
What an ecological assessment is
The domain and its question
The ecological domain is required consideration in a full individual evaluation. In practice, it is often a paragraph.
Say that plainly, because it is true and because this series has no standing to examine anyone else’s shortcuts without naming its own field’s. The environmental and ecological factors section frequently reads as a formality — a sentence about the classroom, a sentence about attendance, a note that the student lives with both parents — filed and never returned to. The domain is the one an evaluator is least likely to have been trained to execute and most likely to complete last, at the end of a long report, under a deadline.
Which is a loss, because the domain asks the only question that can distinguish a child’s deficit from a setting’s.
A behavior cannot be evaluated apart from the conditions that maintain it. That principle is uncontroversial when the setting is a classroom — every diagnostician knows that a child who fails in one room and succeeds in another has told you something about the rooms. The ecological domain simply extends the principle outward and asks what else counts as the setting.
The three pieces before this one examined the system: how it decides what a child can do, what a child knows, what a child is called. This piece examines what the system is standing in.
Stated as plainly as possible: the ecological assessment is where an evaluator is supposed to ask whether the problem is in the child or in the room.
The floor the room stands on
Start where an ecological assessment always starts, at the outermost layer of the setting.
In San Antonio Independent School District v. Rodriguez (1973), the Supreme Court held that education is not among the rights the federal Constitution guarantees, and that funding schools from local property taxes therefore does not violate equal protection even when districts end up spending very different amounts per child. That holding still governs. It is why 50 states can reach 50 different answers about what a disabled child is worth, and why none of those answers is a federal violation.
This is the floor the piece stands on — a condition, not a grievance. Every finding that follows descends from it.
What the domain found
An assessment report states its findings before it defends them, so here is this one.
The environment does not merely fail to permit individualization for a child with a disability.
It prices it.
A word of warning about what follows: the evidence in this domain is fiscal, and fiscal evidence reads at a distance — appropriations, formulas, 50-state tables, none of it obviously about any particular child or any particular Tuesday.
Stay with it, because the distance closes. By the end of this piece, the money will have reached the evaluator’s own chair, and the state will have set a price on the work of finding out what a child needs.
The setting: how states pay, and who they count
The variation, stated durably
Rodriguez settled that 50 different answers are lawful. It did not say how far apart the answers would be.
In fiscal year 2024, New York spent $31,918 per pupil, and Idaho spent $11,060. The national average was $17,619, up 6.6 percent in a single year (U.S. Census Bureau, 2026). That is a spread of roughly three to one, unadjusted for cost of living, which narrows it, and unadjusted for anything else, which does not.
The ratio has held. It was roughly three to one in fiscal 2022, when the range ran from $9,552 in Utah to $29,873 in New York (U.S. Census Bureau, 2024). It was roughly three to one in fiscal 2021 (U.S. Census Bureau, 2023). It is roughly three to one now. The dollar figures climb with every release; the distance between top and bottom does not close.
That stability is the finding, and it needs stating carefully, because the obvious reading is available and wrong. Nothing in the structure closes the gap — not because anyone is holding it open. A disparity that survives three decades of rising appropriations, a pandemic relief surge, and the largest single-year per-pupil increase in 20 years (U.S. Census Bureau, 2024) is not a disparity that funding growth corrects. It reflects how the money is raised.
Which is where the constitutional floor stops being doctrinal and becomes arithmetic. Local sources supplied 43.2 percent of elementary and secondary revenue in fiscal 2024, and property taxes accounted for 63.3 percent of that. States supplied 45.2 percent. The federal government supplied 11.6 percent, down 4.4 percent from the prior year (U.S. Census Bureau, 2026). The largest single input to a child’s education is the assessed value of the land around the building.
The disparity does not stop at state lines. Washington directed its Joint Legislative Audit and Review Committee to examine special education funding, and the AIR study conducted for that committee found that some districts in the state receive nearly four times more state funding per student for special education than other districts (Washington State Joint Legislative Audit and Review Committee, 2024). That is a four-to-one spread inside one state, under one formula, among districts subject to the same rules. The report recommended the state remove its enrollment cap on special education funding and adjust the excess cost multipliers.
Those two ratios measure different things, and both matter. Three to one is the national spread in total per-pupil spending. Four to one is the intrastate spread in state special education dollars per student. The second is the more damning number, and it is the one a reader in any single state can check against their own district.
A district cannot decline a child. It can only decide, within whatever the formula gives it, what that child’s education will consist of.
Who gets counted, and why the obvious answer is wrong
Start with a fact that should not be possible.
Texas pays its school systems per identified child. The more students a district finds eligible for special education, the more state money it generates. That is the arrangement most people assume produces over-identification, and critics of special education funding have warned about it for 50 years.
Texas also identifies fewer children than almost any state in the country — 12.7 percent of enrollment, against 15.2 percent nationally, third-lowest behind Hawai‘i and Idaho (National Center for Education Statistics, 2023). And between 2018–19 and 2022–23 it added roughly 171,000 children to its special education rolls, growing at nearly six times the national rate.
Down to the floor, then up faster than anyone. The payment formula did not change once during either movement.
Whatever moved Texas, it was not a change in the money.
That result is only surprising if you believe funding mechanisms carry incentives straightforwardly. Most writing about special education funding assumes they do, and the assumption survives because two different things get called the same thing.
How a state distributes money and how it counts the students who trigger the money are separate decisions. A state picks one of each. They are independent; they do not cover the same ground, and collapsing them is how a mechanism gets blamed for an incentive it does not create.
The count is where identification pressure actually sits. Thirty states and the District of Columbia count students who have been found eligible and have an IEP — pay per child found. Seven states — California and Vermont among them — count total enrollment instead, or apply a statewide percentage to it, funding a presumed disability rate rather than an actual one (Duncombe & Krieger, 2026).
A state can run the same distribution formula on either count and get opposite pressure. The difference is a line in a data specification, not a philosophy.
Texas counts identified students. It has the incentive, on paper, and the incentive did not produce the behavior. Which means something outside the formula was doing the work — and this piece can say what did not move identification without yet saying what did.
That is the finding here, and it is a negative one: the funding mechanism does not predict identification behavior. Something else does, and the counterweight names it.
The five ways states distribute the money
Everything that follows runs on this vocabulary, so here it is once. The Education Commission of the States classifies state special education funding into five distribution mechanisms (Duncombe & Krieger, 2026). All fifty states and the District of Columbia dedicate state dollars to these services, and many run more than one at once, so the counts below do not sum to 51.
Single weight or per-student grant — 15 states. One add-on percentage or dollar amount applied uniformly for every identified student, on top of the base allotment — the per-student figure a district already receives for that child before any disability is considered. ECS notes the consequence plainly: allocations determined by single weights do not differentiate based on the different services a student receives.
Multiple weights or per-student grants — 25 states and D.C. More than one percentage or dollar figure, differentiated by something. What that something is varies: IDEA disability category, placement, spending, cost estimates, percentage of time in a general education classroom, or hours of direct and related service. Ohio keys its six weights to disability category; Tennessee keys its eight to service hours. Beginning in 2026–27, Texas keys its own to intensity of services — a fourth answer to the same question, and the subject of the next section.
Resource allocation — 6 states. The state prices instructional staffing using average salaries and enrollment, then funds a portion.
Cost reimbursement — 6 states. Districts submit actual expenditures; the state pays back all or a percentage. The design question is which costs qualify, and each state draws that line somewhere different — everything the IEP requires, instruction only, or named categories at differing rates.
High-cost services funding — 36 states. A separate pool covering students whose costs exceed a threshold — averaging about $40,000 among the states naming a dollar figure, and running as high as $100,000. Others set the bar as a multiple of the average per-student amount. ECS is explicit that this is a form of cost reimbursement used in addition to another mechanism, not an alternative to one.
The count attaches to only two of the five. Only single weight and multiple weights award dollars per child, so only they have a count method at all — a rule for which students the formula counts. Resource allocation, cost reimbursement, and high-cost services do not distribute on a per-student basis, which means the question of who gets counted does not arise for them. Texas runs multiple weights on a special education count — which is why the puzzle at the top of this section is a puzzle and not a category error.
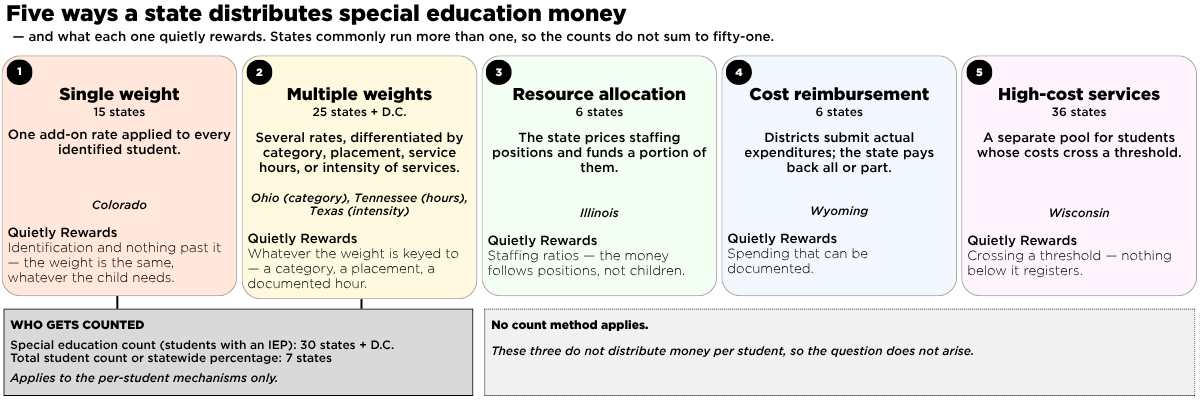
Five mechanisms states use to distribute special education funding, and the two count methods that apply only to the per-student mechanisms. States commonly run more than one mechanism, so the counts do not sum to 51. Source: Duncombe & Krieger, Funding Special Education Services, Education Commission of the States, June 2026 (rev. July 2026), Table #2; count-method figures from the accompanying ECS Funding Special Education Services resource. The “quietly rewards” line on each card is the author’s analytic reading, not part of the ECS taxonomy.
The instrument does not fit the construct
The instrument, described fairly
Texas has built something new, and it deserves an accurate description before it is examined.
Beginning in the 2026–27 school year, special education funding in Texas runs on service intensity. The model sorts students into eight tiers across five service groups. It comes through House Bill 2 and the statutory changes codified at Texas Education Code §§ 48.102 and 48.1021, effective September 1, 2026. Five domains organize the review: Curriculum and Instruction, Behavior, Communication, Independent Functioning, and Personal Care and Health. Within each domain, a reviewer rates four factors — the type, nature, and frequency of services the student receives; whether those services require a specialized provider; whether they require a specific staff-to-student ratio; and whether they require specialized equipment or technology. Each factor is scored from zero to three, on a scale running from No Support Required for FAPE through Minimum, Moderate, and Significant. The highest factor score sets the domain score. The five domain scores sum to a composite, and the composite maps to a tier (Texas Education Agency, 2026a, 2026c).
That structure replaces instructional arrangement, and the improvement is real. Under the old model, funding followed the setting — the resource room, the self-contained classroom, the mainstream period. Money followed the child’s location. Under the new model, money follows what the child is documented to require. Anyone who has watched placement decisions bend quietly toward the weight that pays better understands what a genuine advance that is. This series has no interest in pretending a reform is not a reform.
The tier model is a serious piece of work, built by people solving a real problem. What follows concerns neither their intentions nor their competence. It asks a narrower question: whether the instrument they built can measure the thing it was designed to measure.
The temporal finding
The first draft of this analysis expected to find that the tier was frozen — that once a student was coded, the code would sit there until the annual review came around, and funding would lag behind need by as much as a year. That expectation was wrong. TEA’s own transition guidance is explicit: when an IEP is revised during 2026–27 in a way that changes the tier, the previous tier is closed with an end date, and the revised tier is entered with a begin date reflecting when the new services actually started (Texas Education Agency, 2026a).
So the tier moves. It follows the child.
It follows the child through the document.
The tier changes when the IEP changes, and the IEP changes when an ARD committee convenes, reaches agreement, and writes it down. Every one of those steps is a scheduling problem before it is an educational one. A student’s presentation can destabilize on a Tuesday in October. The tier that funds his services waits for a committee. The instrument’s temporal resolution, then, is the ARD calendar — measured in scheduling windows rather than in school days.
This is the finding, and it is worse than the one I went looking for. A frozen tier would at least be predictable — an obvious lag, correctable by shortening the review cycle. What the rules actually produce is a funding mechanism whose responsiveness depends on the availability of five or six adults with competing calendars, in a system where convening them has a cost the formula now prices.
I spent years as a special education teacher, serving students with FBAs and IEPs. Day-to-day prediction was, in my practice, frequently impossible. The work was approximation, and hoping, and fearing. A student regulated on Thursday might arrive Friday unrecognizable, and nothing in the paperwork anticipated the difference.
An instrument built on the ARD calendar assumes a population whose needs change at the speed of paperwork. It was built to fund a different population entirely.
State the problem in the language of the discipline that owns it: the instrument assumes a stability the construct does not exhibit. That sentence makes a measurement-validity claim, and it belongs to the evaluator’s own vocabulary. An evaluator who says it is speaking from professional authority — it is the same objection any diagnostician would raise against a test that reported a stable score for an unstable trait and offered no error band.
The admissibility finding
TEA wrote the strongest evidence in this piece.
The agency’s April 2026 guidance addresses a question reviewers were evidently already asking: what do I do when I know something about a student that the IEP leaves out? The answer is unambiguous. A reviewer who knows a thing to be true about a student may not treat it as true unless the IEP documents it. A service description that sounds like the student cannot be selected unless the IEP contains it (Texas Education Agency, 2026a).
Read that as a rule of evidence, because it is. The state has written into its funding guidance that the practitioner’s knowledge of the child is inadmissible unless the document says it.
Be scrupulous about why, because the reasoning is legitimate. TEA’s stated purpose is calibration: every reviewer looking at the same IEP should arrive at the same tier and the same service group. That is an inter-rater reliability goal, and reliability is something this series values — Piece 3 built an entire section on coding discipline for exactly that reason. A funding formula that produced different answers depending on who ran it would be indefensible, and TEA was right to anticipate the problem.
But reliability was purchased, and the price is on the receipt. It was purchased by declaring the child unobservable. The funding instrument assesses the student’s paperwork, by design, because assessing the student directly would reintroduce exactly the reviewer-to-reviewer variation the rule was written to eliminate.
This closes a loop this series opened in Piece 3.
The goal bank writes the document. The document determines the tier. The tier determines the money.
Piece 3 established, with a coded corpus of 80 canned goals, that the document is assembled from a menu: 64 percent of those goals sat at Remember or Understand, and 1 percent reached Analyze or above. At the time, that finding spoke to instructional expectations — to what a menu-written document asks a child to do. It now speaks to revenue as well. The vocabulary bank that assembles the document has become, formally and by operation of state rule, a funding instrument.
The error term runs downward
Two more rules from the Funding Tool, both stated plainly in TEA’s guidance.
The default value for every factor is No Support Required for FAPE. A reviewer begins at zero and moves up only on documented evidence.
And when a reviewer is uncertain between two ratings, the guidance directs the lower one (Texas Education Agency, 2026a).
Handle this carefully, because the obvious reading is the wrong one. A conservative default is defensible on its face — it prevents inflation, it puts the burden of proof on the claim rather than the denial, and it is precisely the discipline Piece 3 imposed on its own coding. When that corpus was coded, ambiguous goals were assigned to the higher cognitive level, which biased the sample against the argument the piece was making. Biasing against your own thesis is good methodology. It is what makes a finding worth reporting.
The asymmetry is worth naming, and naming carefully. In Piece 3, the tiebreak ran against the coder’s own interest. Here, the tiebreak runs in the same direction as the payer’s interest. Every uncertain call, aggregated across a state, resolves toward the lower tier and the smaller allotment.
Not evidence of intent, which the piece does not need — a validity observation that belongs in the report the way any error term belongs in a report: a measurement rule whose uncertainty resolves systematically in favor of the party who wrote the rule has an error term worth stating.
Report it. Stop there. A reader who wants to draw a further inference will manage without assistance.
How the room got built: the layering
Every model of disability that has passed through American schooling arrived with a theory about what a disabled child is. Each theory implied a way of paying for one. And each time a new model arrived, the payment mechanism that came with it was added to the ones already in place.
None of the previous ones left.
That claim used to require a historical argument. It no longer does, because the stacking is visible in the present tense. The Education Commission of the States published its updated 50-state classification of special education funding in June 2026 — an update of the 2024 50-State Comparison rather than a new instrument — which is itself the layering thesis in miniature, and the arithmetic does not work the way a taxonomy is supposed to work. Fifteen states distribute money through a single weight. Twenty-five states and the District of Columbia use multiple weights. Six use resource allocation. Six use cost reimbursement. Thirty-six operate a separate high-cost services mechanism on top of whatever else they do. The totals exceed fifty because most states are running more than one mechanism at once, and ECS says so plainly: many states use more than one mechanism, and the columns do not sum.
Some of that stacking is legitimate; a high-cost fund exists to sit on top of something else. But a field that has changed its mind four times, and kept the apparatus each time, would look exactly like this.
And the arithmetic runs in both directions at once. Minnesota established a Blue Ribbon Commission in its 2025 state budget, charged with transforming special education services and identifying $250 million in savings for the 2027 two-year budget period (Laws of Minnesota 2025, 1st Spec. Sess., ch. 10). Texas statute, the same year, directs the commissioner to set weights and service group amounts so the statewide total runs approximately $250 million above what the former system would have generated (Texas Education Agency, 2026c): same figure, opposite sign, same year, two states. The layering thesis rarely gets a matched pair that clean.
The models and their arithmetic
The medical model funds the diagnosis. Money attaches to a verified label, distributed per pupil and weighted by category. The diagnostic gate presents as clinical rigor and operates as a fiscal valve, and the failure mode is the one you would predict: pressure toward the label that pays.
The cleaner American exemplar here is ADHD under Other Health Impairment, which does require a medical diagnosis — not intellectual disability or specific learning disability, which are educational determinations an ARD committee can make without a physician. The medical model describes a seam in American eligibility, not the whole of it, and the distinction matters: where a doctor’s signature is load-bearing, the fiscal valve has a hand on it.
In my practice, during one particular era, the incoherence was easy to see and hard to explain. Students with ADHD were served under Section 504 with accommodations only. Students with dyslexia — a specific learning disability, an educational determination — were also served under 504. Two children of similar severity, sorted by opposite logic into the same thinner plan. The dyslexia-to-504 shuffle was never the medical gate operating. It was the fiscal valve: same determination available, cheaper plan selected.
The social model funds the environment. Money arrives as a census figure — an amount keyed to how many students a district enrolls, not to how many were found eligible — or as a lump sum, decoupled from any individual child’s identification. The theoretical beneficiaries are the undiagnosed and the marginal — the students who need help but would never clear an eligibility threshold. The practical beneficiary is frequently the treasury, because a legislature can adopt social-model language while executing a savings agenda, and no per-child claim exists to audit the result against.
Vermont is the case in point, and it is worth telling straight because it did not go the way its designers intended. Act 173, passed in 2018 (Vermont Act 173, 2018), moved the state from reimbursement to a census block grant, explicitly aligned with multi-tiered systems of support and with individual entitlement preserved. An adequacy study that preceded it projected roughly $142 million in annual savings — and stated the condition attached to that number: fewer students would be identified, which in turn depended on about $95 million a year in “extra help” resources reaching children before identification (Odden & Associates, 2016, as cited in Kolbe & Killeen, 2017). The savings were real only if the investment came first.
What happened instead is that the block grants were calculated on total district enrollment, with no reference to the students actually receiving services. About three-quarters of districts and supervisory unions were projected to lose money under it (D’Auria, 2022), and implementation was delayed more than once (Census-Based Funding Advisory Group, 2023). And in July 2025, Vermont enacted Act 73, which moves the state back toward weighted special education funding by 2027 and orders a fresh comprehensive review of the reforms that took effect 3 years earlier (Vermont Act 73, 2025).
This surfaces something American special education has never fully reckoned with. IDEA’s individual entitlement, whatever medical-model freight it carries, is what makes special education funding litigable here. An entitlement hands a family an enforceable claim. A census allocation, fiscally implemented, can dissolve that claim while leaving the rhetoric of inclusion entirely intact.
The educational model funds the service. Money follows intensity of need, wherever the child sits and whatever the label says. The failure mode migrates instead of disappearing: classification pressure moves off the diagnostic taxonomy and onto the service-minutes documentation. This is the model the Texas tier system implements, which is why its failure mode was the subject of the previous section.
The industrial model funds the throughput. No one claims this model, and nearly everyone implements some of it. Funding attaches to procedural documentation, and results go unpriced. Placement-based weights pay for sorting. Cost-containment instruments ride along beside the allotments. The beneficiary is the general education system, which has its variance removed, processed elsewhere, and paid for.
What the mechanisms quietly reward
The mechanisms carry incentives their designers describe in the language of principle, and the school-finance literature has long described the same tradeoffs (Cullen, 2003; Dhuey & Lipscomb, 2013; Kwak, 2010). Weighted funding follows identification, which is said to discourage early intervention, since the money arrives after the label. Census funding is said to encourage it, while failing to fund the expensive child — which is why 36 states bolt a high-cost mechanism onto whatever else they run. Reimbursement pays for expenditure, rewarding spending and leaving judgment unpaid. Resource allocation pays for staffing ratios, and so the ratio is what it buys.
Those are design expectations, and the setting has already shown that design expectations are a poor guide to what a state actually does. California is the cleanest test available. It abandoned service-based funding in 1998 precisely to remove the incentive to identify (Legislative Analyst’s Office et al., 1995), replacing it with an attendance-based formula that pays the same whatever a district finds. Identification steadied for roughly a decade. Then, after 2010, it climbed anyway (Legislative Analyst’s Office, 2019) — under a formula built to make climbing pointless. Texas ran the opposite arrangement and produced one of the lowest identification rates in the country. Two states, opposite mechanisms, and neither outcome matches what the mechanism predicts.
Two details are worth holding onto, because they are where the incentive actually lives.
First, the mechanism is not the whole story. ECS separates how a state distributes money from how it counts the students who trigger it, and identification pressure sits in the count. Thirty states and the District of Columbia count students actually identified with an IEP. Seven count total enrollment, or apply a statewide percentage to it. A state can run weighted funding on a total-enrollment count and remove the incentive to identify, or run the same weights on an identified count and keep it. Same mechanism, opposite incentive, and the difference is a line in a data specification rather than a philosophy. Whether the incentive is where the behavior comes from is a separate question. Econometric studies find that fiscal incentives move identification at the margin (Cullen, 2003; Dhuey & Lipscomb, 2011; Kwak, 2010); the two cases here show that something else moves it more.
Second, the pushback comes from where you might not expect. Cost hawks do not raise the equity objection to census funding; it comes from advocates. The Education Law Center has argued that funding at a statewide average classification rate systematically underfunds districts above that average (Farrie & Ciullo, 2024). Its Wisconsin study puts a mechanism under the objection: high-poverty and majority-minority districts tend to identify a larger share of their students, so a formula built on a statewide average leaves them further short. In 2019–20 the highest-poverty districts in that state diverted $1,818 per pupil out of general education to cover the gap, against $1,266 in the lowest-poverty districts (McKillip & Farrie, 2022) — a shortfall that lands hardest on the districts with the least to divert.
The layer arriving now
The most useful thing about the layering thesis is that readers don’t have to take it on historical faith. It is happening in Texas this year, in public, on a published schedule.
Instructional arrangement codes — the old model, the one that funded where a child sat — continue through the 2026–27 school year and disappear in 2027–28 (Texas Education Agency, 2026b, 2026c). Tier reporting began October 8, 2026. Districts will therefore operate both systems simultaneously for a full year, coding each student twice under two incompatible theories of what generates funding.
That is what a layer looks like while it is being laid. The new model is added. The old one leaves a year later, and only because someone wrote an end date into the rule. The Texas tier system is also, on the 50-state map, a change within a family rather than a departure from one: Texas was already a multiple-weights state counting identified students, and it remains one. The weights became tiers. The count did not move.
And the arrival came with money. Statute directs the commissioner to set the weights and service group amounts so that the statewide total runs approximately $250 million above what the former system would have produced (Texas Education Agency, 2026c). Whatever else the tier model is, it arrived with more money attached, not less. The finding about the instrument was never that the state was trying to save on this transition. It was that the instrument cannot see the child — a problem a funding increase leaves exactly where it found it.
Texas as the local exhibit
Every finding so far has been national. An ecological assessment does not stop at the general condition — it asks what the setting looks like where the child actually sits. So: does the national pattern reproduce in the jurisdiction this examiner works in?
It does, and in one respect it goes further, because Texas has done something no other state has. It has attached a price to the evaluation itself.
The evaluation bounty
House Bill 2 created Texas Education Code §48.159. Under it, a school system receives $1,000 for each completed full individual and initial evaluation. The payment covers children enrolled in public school, private school, and homeschool alike. The trigger is the completed evaluation, not the ARD that follows it and not the eligibility decision that comes out of it. Initial evaluations only; reevaluations generate nothing (Tex. Educ. Code Ann. § 48.159, West 2026; Texas Education Agency, 2025).
Read that as a mechanism, and it is the reimbursement card from the setting, turned around and pointed at the reader’s desk. A per-unit payment for the act of evaluating, disconnected from what the evaluation finds. The diagnostician’s own labor has become a billable unit, and this series — which has spent four pieces evaluating a system — has arrived at the point where the system’s funding formula reaches the evaluator’s chair and assigns her a rate.
A word exists for a per-child payment that rewards identification, and the federal government used it first. When Congress moved the IDEA formula off headcount in 1997, the Department of Education’s Inspector General had already described the old arrangement as a bounty system — one that encouraged putting children in special education who did not belong there (U.S. Department of Education, Office of Inspector General, 1994). Congress agreed and removed the incentive. Twenty-nine years later, Texas installed one.
Handle that observation carefully, because the parallel is real but the equivalence is not. The 1997 formula paid states for every identified child, continuously, for as long as the child stayed identified. Texas pays once, for the evaluation, whatever the evaluation concludes. A district that evaluates a child and finds no disability is paid the same $1,000 as a district that finds one. Structurally, that is a payment for throughput, not for identification — which is a meaningfully different incentive, and arguably a better-designed one.
It may also do some good. Texas spent years under federal correction for failing to evaluate children who needed evaluating, and a payment that makes evaluations easier to fund is a rational response to that history. More children evaluated is not obviously worse than fewer. The bounty may well increase the number of evaluations completed, and some of those evaluations will find children who would otherwise have gone unfound.
State the mechanism and let it sit. It rewards completion, not accuracy. It rewards volume, not judgment. Whether that produces better evaluations or merely more of them is an empirical question the state has not yet asked, and the answer will arrive in the aggregate long before anyone traces it back to a formula.
Classification before the price list exists
The tier weights do not exist yet.
They will be set at near-final settle-up in September 2027, based on the PEIMS Summer Submission — which means the state will determine what a Tier 3 is worth after a full year of children have already been coded as Tier 3. Districts are held harmless for 2026–27: no system receives less than it would have generated under the instructional arrangement. Beginning in 2027–28, that floor disappears and funding runs on tiers alone (Texas Education Agency, 2026c).
So districts will spend a year sorting children into eight categories without knowing what any category pays.
This has a neutral reading, and it is probably the correct one. Weights cannot be set responsibly without data; the data does not exist until districts generate it, and someone has to go first. The hold-harmless provision exists precisely to absorb the risk of that sequence. A transition artifact — transitions have them.
It is still worth putting plainly in front of a reader: the classification is happening first, and the money is being attached to it afterward. Whatever else can be said about that order of operations, it means the coding decisions made this year were made by people who the price could not have influenced — and it means the price will be set by people who can see exactly how the coding came out.
Who does the coding
TEA has not specified who completes the funding tool (Texas Education Agency, 2026a).
The agency requires no particular position, credential, or role. The tool itself retains nothing between sessions — no account, no password, no saved state; a reviewer exports to a spreadsheet or loses the work. And in summer 2026, TEA offered a one-time extra-duty stipend grant to cover staffing costs for reviewing student records and determining tiers, service groups, and minutes in the special education setting. Systems accepting the grant agreed to submit at least 10 percent of their special education population through an early data request by August 14 (Texas Education Agency, 2026b).
Assemble those three facts and a picture emerges that no one designed and everyone will recognize. The state has built an instrument that converts documentation into money, declined to say who is qualified to run it, provided no way for the instrument to remember what was entered into it, and paid a stipend for the work to be done over a summer, at extra duty, by whoever was available.
That is the room. The last movement of this piece follows the chain from here to the desk where the coding actually happens.
The counterweight: rooms built differently
An ecological assessment that catalogs only deficits is a bad ecological assessment. It describes a setting as though the setting could have been no other way, which is the same error as describing a child’s score without asking what produced it.
So the question owed to the reader now is whether any of what came before was necessary. Was the environment built this way because funding a disabled child is intrinsically hard? Or was it built this way because someone chose, among available options, this one?
The lever is not the formula
The setting left a puzzle on the table. Texas pays its districts per identified child and identifies fewer children than almost any state in the country. Take that as given here; the question now is what did move.
Start with what did not. Across the whole period in question, Texas ran multiple weights on a special education count. It ran them before its identification rate fell to the national floor, while the rate sat there, and after the rate began climbing. The distribution mechanism and the count method were the same instrument throughout.
The outcome moved twice anyway.
In 2022–23, Texas served 703,058 students aged 3 through 21 under Part B of IDEA — 12.7 percent of its public school enrollment, compared with a national rate of 15.2 percent. Only Hawai‘i and Idaho identified a smaller share of their students. Across the five years from 2018–19 to 2022–23, Texas added roughly 171,000 children to that count — an increase of 32.1 percent in students served, against national growth of 5.5 percent over the same window (National Center for Education Statistics, 2023).
Nearly six times the national growth rate, yet a headcount that still left Texas third from the bottom. Both facts are true at once, and both were produced under an unchanged formula.
The window matters, and it is worth naming precisely. Those five years begin in 2018–19, the year after the federal Office of Special Education Programs issued its first noncompliance findings against the state. A reader who starts the clock somewhere else will get a different number, which is why the years are named.
This is the shape of a within-subject design with a control condition, and an evaluator should recognize it. One system, observed across time. The instrument held constant. The outcome moving twice, in opposite directions, while the thing most people would name as the cause sat still.
Which sharpens the claim. It is not that the same lever can be run in both directions. It is that the funding formula was never the lever. What moved Texas identification down, and what moved it back up, happened in the monitoring system while the money kept arriving by the same arithmetic.
State the limit with the finding, because this piece did not run the rule-out that would close it. Monitoring pressure is named here as the variable that covaries with the outcome — it moved when the rate moved, in the direction the rate moved. That is not the same as eliminating every alternative, and the discipline of eliminating alternatives belongs to the functional analysis in Piece 5. What this evidence can say is the negative half, and it says it flatly: whatever moved, it was not the formula.
Widen the frame and the same point can be made a second way, with a second system, in the opposite direction.
Caps run in both directions
Consider identification caps — rules that constrain how many children a system identifies as disabled. In 1997, Congress adopted one. In 2004, Texas adopted one. They pointed in opposite directions and produced opposite outcomes. They also worked through different machinery, and that difference turns out to be the point.
The federal shift. When Congress reauthorized IDEA in 1997, it changed how Part B money reaches states. The old formula paid by headcount: the more children a state identified, the more federal money it received. The House committee report accompanying P.L. 105-17 gave a two-part rationale for changing it (House Committee on Education and the Workforce, 1997). The 1975 access goal had substantially been met — states were no longer failing to serve children with disabilities at the scale that had prompted the original act. And a new problem had emerged: minority children were being identified disproportionately, concentrated in the subjective categories where clinical judgment does the most work.
The committee’s language is worth attending to, because it frames the change as a corrective rather than a savings. It wanted to address over-identification. It wanted states to help struggling children in general education without the unnecessary categorization the old formula rewarded. And it hoped changing the federal formula would prompt states to change their own, eliminating what the Department of Education’s Inspector General had bluntly called a bounty system.
The mechanics: once the change took effect, no state lost ground against its prior year, and money above that floor ran on child population and poverty — how many children live here and how poor are they — rather than on how many had been identified (Individuals with Disabilities Education Act Amendments of 1997).
Congress removed a financial incentive to label children. That is a civil-rights corrective, and this series should say so plainly, because it is the one place in this piece where the system is shown getting something right.
The Texas indicator. Seven years later, Texas reached for a different instrument entirely.
Beginning in 2004, the Performance-Based Monitoring Analysis System flagged any district identifying more than 8.5 percent of its students for special education. Flagged districts filed corrective action plans. TEA maintained throughout that the figure was an indicator of district performance and not a cap, and that distinction is real as a matter of drafting — nothing in the rule forbade a district from exceeding it.
The rule made exceeding it expensive in administrative attention, which, in a system already short of administrative attention, functions as a ceiling. Texas identification fell from roughly 12 percent, near the national average, to exactly 8.5 percent by 2015 — the lowest rate in the country against a national figure near 13 percent. The Houston Chronicle documented the consequence in 2016 (Rosenthal, 2016). OSEP investigated, found Texas noncompliant with Child Find and FAPE requirements, and concluded in 2018 that the state’s adoption and multi-year implementation of the indicators had illegally incentivized districts to under-identify (U.S. Department of Education, Office of Special Education Programs, 2018). TEA stopped enforcing the indicator in late 2016, and in 2017 the Legislature barred any monitoring indicator built solely on a district’s overall special education rate (Tex. Educ. Code Ann. § 29.0011, West 2026).
Hold the two side by side without collapsing them, because the machinery is different. Congress rewrote a funding formula. Texas set a monitoring threshold and left its funding formula alone. One was designed as a civil-rights remedy and functioned as one. The other was designed — by TEA’s own account — as an indicator of district performance, and functioned as a denial of services to children who qualified for them — and peer-reviewed analysis has since tied it to Black students and English learners becoming progressively less likely to be identified than their peers in neighboring states (Morgan et al., 2023).
But note what the two share, because it is the finding. Both were responses to the same stated concern. A former TEA deputy commissioner for finance said on the record that there was always a concern about over-identification and the costs associated with it (Rosenthal, 2016). That is nearly the language of the House committee report. Same worry, different machinery, opposite ends of the result. What separates the outcomes is where each system was aiming — and, on the Texas evidence, which machinery it aimed with.
Neither instrument carries a moral direction of its own. A formula can be rewritten to stop rewarding labels, and a monitoring threshold can be set to punish them; the outcome tracks whether the system is trying to serve or trying to ration. That is what it means to say the environment is a choice — not that better places exist somewhere, but that this country produced both results inside a decade, and that the one which moved identification hardest was never the one that moved the money.
Other rooms, built differently
Three shorter exhibits, each doing a distinct job.
A state that simply pays. Wyoming reimburses school districts for the full cost of services required by a student’s IEP. Districts submit expenditures, the state reviews them, and it reimburses approved costs at 100 percent. It is the only state in the country that does this (Duncombe & Krieger, 2026). Whatever objections can be raised to the design — and reimbursement models carry their own well-documented incentive problems — Wyoming shows that an American state can decline to make the funding formula the constraint on what a child receives. The instrument exists. One state runs it.
A reform pointed the right way that failed anyway. Vermont’s Act 173, discussed earlier in the layering, deserves one more sentence here in a different key. It was designed with care: aligned to multi-tiered supports, individual entitlement preserved, savings explicitly conditioned on prior investment in early help. It still went wrong, because the money was distributed on total enrollment while the obligation stayed with actual students, and in July 2025 the state legislated its way back toward weights. Read that as an argument about arithmetic rather than about census funding. Good intentions in a funding formula survive exactly as long as the numbers underneath them hold, and watching those numbers is what this domain is for.
A federal system that produces a different outcome. Piece 3 established the international norm group, and this piece will not re-argue it. The finding carries forward: Switzerland and Canada, both federal systems, show disability employment gaps under 20 points, compared with the United States at 42.4 (Organisation for Economic Co-operation and Development, 2022; U.S. Bureau of Labor Statistics, 2026). Switzerland is in some respects more devolved than the United States — its cantons administer their own disability insurance offices, with documented variation in service accessibility across cantonal lines. It has the American structural problem and does not produce the American outcome.
Which forecloses the most available explanation for everything in this piece. Federalism is not the cause. Other federal systems face the same coordination problem, the same subnational variation, the same difficulty in setting a national floor — and arrive somewhere else.
The environment described so far was assembled from choices. Every one of them could have been made differently, and in at least one American state, or one Swiss canton, it was.
Micro-level industrialization: the room reaches the desk
Everything in this piece so far has happened above the practitioner’s head. Constitutional holdings, 50-state distributions, legislative sessions, agency rulemaking — a reader could take all of it as background noise, the weather a job happens in rather than anything that touches the work itself.
This section closes that distance. The funding formula reaches all the way to the menu on her screen.
The chain
Follow it one link at a time.
The state assigns a tier. The tier determines the funding level. The funding level attaches to a documented service intensity, which means the document must say certain things for certain money to arrive. And the person writing the document carries a caseload that makes deliberation over each sentence a luxury the calendar does not extend.
So she reaches for a matrix. A menu. A prewritten bank of goals with the verbs already chosen and the criteria already specified, needing only a name and a percentage.
That reach is the most rational thing about the whole system.
What Skrtic saw, and where it lands
The observation is not new. Thomas Skrtic made it in 1991, working from Mintzberg’s typology of organizational forms, and the passage that matters here is one sentence long in substance.
Schools, he argued, are configured by the technical demands of their work as professional bureaucracies — organizations that coordinate by standardizing the skills their workers bring, leaving those workers wide discretion in applying them. That is what teaching is — and what evaluation is, too. But schools are conceptualized, managed, and governed as if they were machine bureaucracies, which coordinate instead by standardizing work processes and formalizing worker behavior. Managers push them that way. So does the institutional environment they sit inside. The result, in Skrtic’s account, is that the professional bureaucracy is driven to be more like the machine bureaucracy, adopting the trappings of rationalized work that are ill-suited to complex work (Skrtic, 1991).
He argued that this is at the level of the organization — the school as a production system, the district as a plant.
Locate it one level lower, at the place where it is actually observable, and it stops being a theory about institutions and becomes a description of a Tuesday. The rationalization of work is a dropdown. The standardization of work processes is a template with required fields. The formalization of worker behavior is a compliance timeline with a deadline attached to each stage. None of these arrive as policy. They arrive as software, and as the only way to finish by Friday.
Call it micro-level industrialization: the machine-bureaucracy pressure Skrtic identified, arriving at the individual practitioner’s workflow and reorganizing it.
The closing of the loop
Now set that beside the admissibility finding.
She reaches for the menu because the conditions of the work make reaching for the menu the only way through. The menu writes the document. And the document — per TEA’s own guidance, in language the agency wrote itself — is the sole admissible evidence of what the child needs. What she knows about the child, having sat with him, tested him, watched him in a classroom, and talked with the people who teach him, cannot enter the funding determination unless it appears in the file.
The state has ruled her knowledge of the child inadmissible where the money is decided, and arranged the conditions of her work so that recording it is the first thing to go.
Both halves of that sentence were built by people solving real problems. The admissibility rule exists to make tier assignments reliable across reviewers, which is a legitimate measurement goal. The conditions of the work are the accumulated result of decades of funding decisions, none of which were made with her calendar in view. Neither half was aimed at her. Together they produce a system in which the most informed observer of a child’s needs is structurally prevented from contributing what she observed.
What this section is not permitted to say
A caution, and it is a real one.
The practitioner reaching for the goal bank is not the failure in this system. She is the informant. She has been reporting the presenting problem accurately for decades — in the shortcuts she takes, in the templates she builds, in the workarounds she shares with colleagues — to an examiner who never showed up to record the report. This series is that examiner arriving late.
Menus and matrices are the rational response of a competent person operating under throughput conditions she did not design and cannot change from her chair. Reading them as evidence of professional decline gets the causal direction backward, and it is the same move as reading a child’s low score as evidence of a child’s deficiency without ever asking about the room.
Every finding here lands on the room. None of them land on the person in it.
There is one further question this piece can see and will not answer: what the shortage does — whether the chronic understaffing of evaluation work serves a function for the system that tolerates it. That is a question about behavior and its maintaining conditions, and it belongs to the functional behavior assessment in Piece 5. This piece establishes the setting. The next one asks what the setting is for.
Closing
The domain finding, stated for the record
The ecological domain asks whether the environment permits the behavior the system says it wants.
It does not. Not because anyone forbade it — but because the instrument the environment uses to see the child cannot see the child. It can only see the paperwork. And the paperwork was assembled from a menu that was never about this child, by a practitioner the state has ruled cannot testify, in the funding determination, to what she knows.
The environment does not fail to permit individualization. It has built an instrument for which individualization is not a legible input.
What the domain could not determine
An assessment report says what it could not answer. This one has three.
Whether the environment was built this way on purpose. The piece declined to find intent throughout, and the layering evidence does not supply it. What that evidence shows is accumulation — five mechanisms coexisting, none retired, a new Texas layer arriving on a published schedule while the old one runs another year. Accumulation is compatible with intent and equally compatible with nobody ever deciding to stop. The evaluation cannot distinguish them, and it does not need to. The instrument is invalid either way.
Why identification rates move. The setting established what does not move them — the funding mechanism. Texas pays per identified child and identifies fewer children than almost any state, then identifies them much faster while the formula sits unchanged. The counterweight names monitoring pressure as the variable that does move. But naming a variable that covaries is not the same as ruling out the alternatives, and this piece ran no such rule-out. Piece 5 owns that discipline.
What the shortage does. The last section sees the question and declines it by design: whether the chronic understaffing of evaluation work serves a function for the system that tolerates it. That is a functional question, and it belongs to the instrument built to answer functional questions.
Naming these keeps the piece honest about its own reach, and each one hands forward rather than trailing off.
Piece 5 — The FIE - Behavioral Domain. What the system’s maladaptive behaviors accomplish, and what keeps them in place.
Piece 6 — The FIE - Conclusions and Recommendations. What the evaluation found, and what an appropriately ambitious program would require — published on a schedule that answers to the argument, not the news cycle.
Related Hub Tools

References
- Census-Based Funding Advisory Group. (2023, January 13). [Report on the implementation of Act 173, submitted to the Vermont General Assembly]. https://legislature.vermont.gov/Documents/2024/WorkGroups/Senate%20Education/Reports%20and%20Resources/W~Agency%20of%20Education~Census-Based%20Funding%20Advisory%20Group~1-13-2023.pdf
- Cullen, J. B. (2003). The impact of fiscal incentives on student disability rates. Journal of Public Economics, 87(7–8), 1557–1589. https://doi.org/10.1016/S0047-2727(01)00203-1
- D’Auria, P. (2022, May 29). Vermont is changing how it funds special education. Some school districts say it’s not being done fairly. VTDigger. https://vtdigger.org/2022/05/29/vermont-is-changing-how-it-funds-special-education-some-school-districts-say-its-not-being-done-fairly/
- Dhuey, E., & Lipscomb, S. (2011). Funding special education by capitation: Evidence from state finance reforms. Education Finance and Policy, 6(2), 168–201. https://doi.org/10.1162/EDFP_a_00031
- Dhuey, E., & Lipscomb, S. (2013). Funding special education by total district enrollment: Advantages, disadvantages, and policy considerations. Education Finance and Policy, 8(3), 316–331. https://doi.org/10.1162/EDFP_a_00098
- Duncombe, C., & Krieger, K. (2026, June 25). Funding special education services [Policy brief]. Education Commission of the States. https://www.ecs.org/wp-content/uploads/PB-0626_Funding-Special-Education-Services.pdf
- Farrie, D., & Ciullo, T. (2024). A roadmap for improving New Jersey’s school funding formula: The impact of census-based funding for special education (ED650129). Education Law Center. https://eric.ed.gov/?id=ED650129
- House Committee on Education and the Workforce. (1997). Individuals with Disabilities Education Act Amendments of 1997 (H.R. Rep. No. 105-95). U.S. Government Printing Office. https://www.congress.gov/congressional-report/105th-congress/house-report/95/1
- Individuals with Disabilities Education Act Amendments of 1997, Pub. L. No. 105-17, 111 Stat. 37 (1997).
- Kolbe, T., & Killeen, K. (2017). Study of Vermont state funding for special education [Report submitted to the Vermont Agency of Education]. University of Vermont. https://legislature.vermont.gov/assets/Legislative-Reports/edu-legislative-report-special-education-funding-study-executive-summary-and-full-report.pdf
- Kwak, S. (2010). The impact of intergovernmental incentives on student disability rates. Public Finance Review, 38(1), 41–73. https://doi.org/10.1177/1091142109358707
- Laws of Minnesota 2025, First Special Session, ch. 10 (K–12 education finance; Blue Ribbon Commission on Special Education). https://www.revisor.mn.gov/laws/2025/1/Session+Law/Chapter/10/
- Legislative Analyst’s Office. (2019, November 6). Overview of special education in California. https://lao.ca.gov/Publications/Report/4110
- Legislative Analyst’s Office, California Department of Education, & California Department of Finance. (1995, November). New funding model for special education: Final report. https://lao.ca.gov/1995/110195_special_ed/se1195toc.html
- McKillip, M., & Farrie, D. (2022, October). Wisconsin’s special education funding crunch: How state underfunding disproportionately harms students in high-poverty districts (ED624522). Education Law Center. https://eric.ed.gov/?id=ED624522
- Morgan, P. L., Woods, A. D., Wang, Y., & Gloski, C. A. (2023). Texas special education cap’s associations with disability identification disparities of racial and language minority students. Exceptional Children, 89(2), 125–141. https://doi.org/10.1177/00144029221109849
- National Center for Education Statistics. (2023). Children 3 to 21 years old served under Individuals with Disabilities Education Act (IDEA), Part B (Table 204.70). In Digest of education statistics. U.S. Department of Education, Institute of Education Sciences. https://nces.ed.gov/programs/digest/d23/tables/dt23_204.70.asp
- Organisation for Economic Co-operation and Development. (2022). Disability, work and inclusion: Mainstreaming in all policies and practices. OECD Publishing. https://doi.org/10.1787/1eaa5e9c-en
- Rosenthal, B. M. (2016, September 10). Denied: How Texas keeps tens of thousands of children out of special education. Houston Chronicle. https://www.houstonchronicle.com/denied/1/
- San Antonio Independent School District v. Rodriguez, 411 U.S. 1 (1973).
- Skrtic, T. M. (1991). Behind special education: A critical analysis of professional culture and school organization. Love Publishing.
- Texas Education Agency. (2025, September 18). HB 2 implementation: Special education program and funding updates [To the Administrator Addressed correspondence]. https://tea.texas.gov/taa-letters/hb-2-implementation-special-education-program-and-funding-updates
- Texas Education Agency. (2026a). Intensity of services special education funding model resources [Funding tool, framework, and frequently asked questions]. https://spedsupport.tea.texas.gov/resource-library/intensity-services-special-education-funding-model-resources
- Texas Education Agency. (2026b, May 28). Special education funding update [To the Administrator Addressed correspondence]. https://tea.texas.gov/taa-letters/special-education-funding-update
- Texas Education Agency. (2026c, April 16). Special education funding updates [To the Administrator Addressed correspondence]. https://tea.texas.gov/taa-letters/special-education-funding-updates
- Tex. Educ. Code Ann. § 29.0011 (West 2026).
- Tex. Educ. Code Ann. § 48.102 (West 2026).
- Tex. Educ. Code Ann. § 48.1021 (West 2026).
- Tex. Educ. Code Ann. § 48.159 (West 2026).
- U.S. Bureau of Labor Statistics. (2026). People with a disability: Labor force characteristics — 2025 (USDL news release; Table 1, 2025 annual averages). U.S. Department of Labor. https://www.bls.gov/news.release/disabl.t01.htm
- U.S. Census Bureau. (2023, May 18). Public school spending per pupil experiences largest year-to-year increase in more than a decade [Press release]. https://www.census.gov/newsroom/press-releases/2023/public-school-spending.html
- U.S. Census Bureau. (2024, April 25). Largest year-to-year increase in over 20 years for public school spending per pupil [Press release]. https://www.census.gov/newsroom/press-releases/2024/public-school-spending-per-pupil.html
- U.S. Census Bureau. (2026, May 7). Public school spending per pupil reaches historic high in 2024 [Press release]. https://www.census.gov/newsroom/press-releases/2026/school-system-finances.html
- U.S. Department of Education, Office of Inspector General. (1994). Audit of the special education funding formula. U.S. Department of Education.
- U.S. Department of Education, Office of Special Education Programs. (2018, January 11). [Differentiated monitoring and support letter and enclosure to the Texas Education Agency]. https://tea.texas.gov/sites/default/files/OSEP%20011118.pdf
- Vermont Act 173, H.897 (2018) (special education funding and service delivery).
- Vermont Act 73, H.454 (2025) (education finance and special education reform).
- Washington State Joint Legislative Audit and Review Committee. (2024, December). Performance audit of special education: Funding formulas and spending. https://leg.wa.gov/jlarc/reports/2024/SPED/f_01/defaultpart2.html