What does the system actually produce? Piece 2 asked how the system thinks; this domain scores its output the way the system scores a child’s — standardized measures first, then work samples, then error analysis, then functional performance, then interpretation, and then the summary the whole file is for. Same instruments, same order, same standard of evidence.
The Domain Turn
In Piece 2, the assessment focused on the system’s cognitive abilities, specifically its crystallized knowledge, fluid reasoning, processing speed, and working memory. Analysis in these areas showed strength in the system’s ability to acquire facts and adhere to routines, but a clear weakness in its ability to handle novel problems, quickly adjust to change, and retain what it has learned.
That domain also found something underneath the scores. When the system decides what a child’s education is for, it has four ways of answering, and they point in four different directions. The medical lens asks how close to a non-disabled peer the child can get. The industrial lens asks what can be documented on the form. The social lens asks what the environment must change so the child can participate. The educational lens asks what will prepare the child for further education, employment, and independent living, the three destinations IDEA itself names. The first two set the ceiling on the child. The third gets cited and rarely used. The fourth is written into the law and has not been observed in operation.
That is a profile, and a profile is only a prediction. This domain, Academic Achievement and Functional Performance, stops asking how the system thinks and starts scoring what it makes. The prediction earns a hypothesis about the product. It does not earn the findings. Those the instruments supply, or fail to.
The method is the one the system uses on children, turned around and pointed at the system: standardized measures, then work samples, then error analysis, then functional performance, then interpretation, then the summary the whole file is for. One rule carries over from the last domain: no score means anything by itself. A number is legible only against the right comparison group, under stated conditions. Every measure that follows is read that way, with the same refusal to let a moved criterion count as progress.
The Standardized Battery
The instrument
The achievement record for this evaluation comes from the system’s own instrument. The National Assessment of Educational Progress (NAEP) is the closest thing American education has to a national achievement test (NCES, 2024b), given under the same conditions everywhere. It has one great virtue here: the system built it, funds it, and gives it to itself. Whatever the scores say, nobody chose this test to make the student look bad.
A word on testing conditions, because an evaluator states those first. Every score below comes from NAEP’s IEP-only category: students with an Individualized Education Program, not counting students served solely under Section 504 — the population IDEA governs. The category only exists from 2009 forward, so the record runs 2009 through 2024. The mandate is 50 years old. We can see 15 of them clearly.
Two limits, stated up front. First, NAEP does not test everyone: in 2024, roughly one in ten identified students was left out of the testing altogether (NCES, 2025), and NCES says plainly that the results describe the students who were assessed, not all students with disabilities. Second, and more important, NAEP cannot measure growth. It never follows the same child. It photographs this year’s fourth graders, then a different set of fourth graders two years later. So the natural parent question, does my child’s gap get bigger as she moves up through school, is one this test cannot answer. What it can answer is whether fourth graders with IEPs are doing better or worse than fourth graders with IEPs used to do. That question it answers clearly, and the answer is the finding.
How to read the numbers
Three terms carry this section. None of them requires a statistics course.
A scale score is just points on the test. The number means nothing by itself. A 210 is not a percentage, not a grade level, not a count of anything. What it can do is move: this year’s fourth graders against an earlier year’s fourth graders, one group of students against another, within the same grade and subject. Movement and distance are the whole story.
The gap is the distance between two averages: students with IEPs and students without, in the same grade and subject. A widening gap means the two groups are pulling apart. A narrowing gap means they are coming together, though as this record shows more than once, a gap can narrow for the wrong reason. The direction of a gap tells you nothing about which group moved.
Statistically significant means something narrower than important. NAEP tests a sample of students, not every student, so every average carries a margin of error, the same way a standard score in an evaluation report comes wrapped in a confidence interval. A change is called significant when it is too big to be explained by which students happened to land in the sample. The p-values throughout this section measure exactly that: the chance that random luck alone would produce a difference this large. Smaller is stronger, and the conventional line sits at .05.
Two rules follow, and this section holds both. No significant change does not mean nothing happened; it means whatever happened was too small to tell apart from zero, so this section claims no movement there in either direction. And the .05 line is applied evenly: a result that would strengthen this evaluation’s case but fails the test is reported as no change, exactly like one that would soften it. Every trend sentence in this domain can be checked against its p-value, and the reader is invited to.
The results: the decade before the disruption
Figure 1
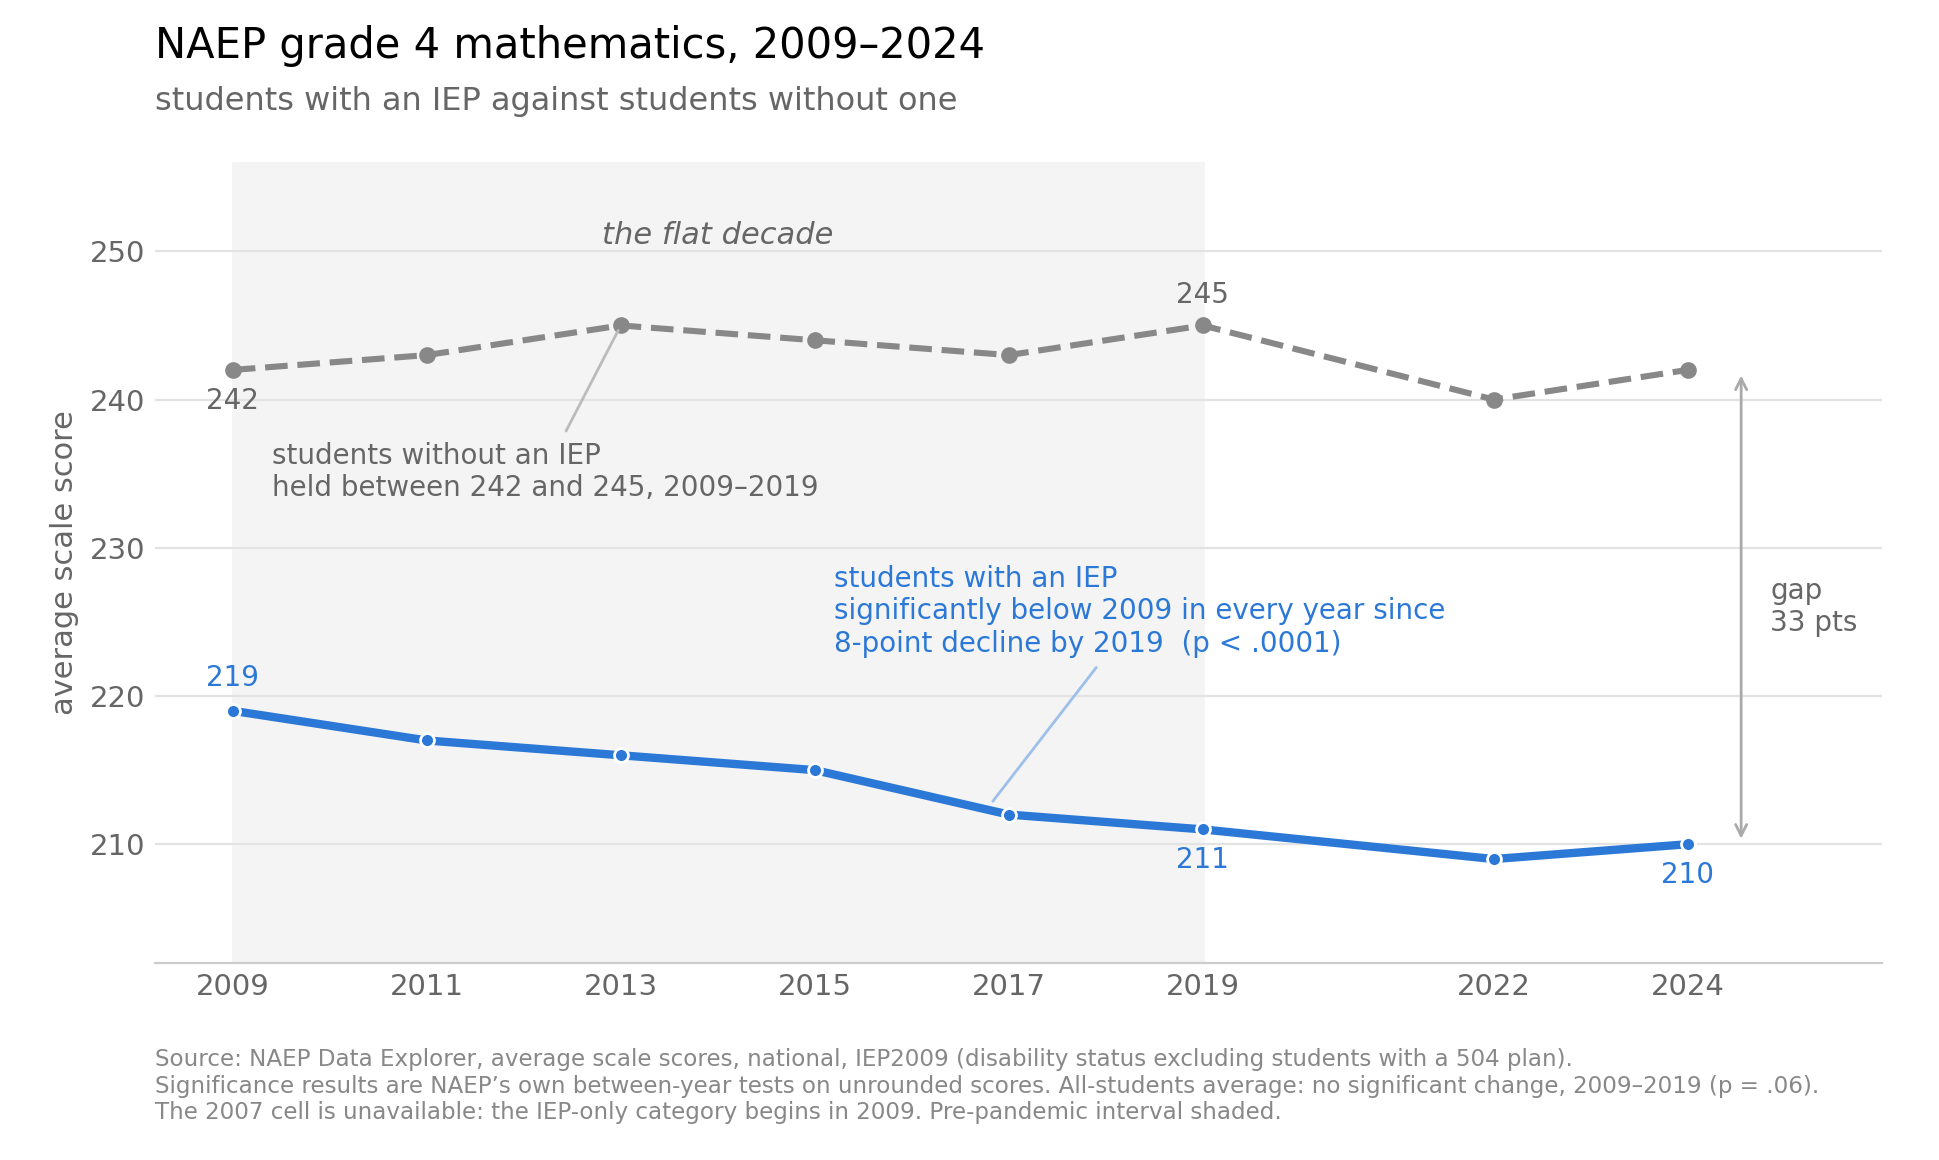
Grade 4 mathematics is the exhibit because it is the cleanest. Between 2009 and 2019 — 10 years of ordinary operations, nothing to blame — the average scale score for students with IEPs went 219, 217, 216, 215, 212, 211. A staircase, down, at every administration. Over the same decade, the all-students average did not significantly change (p = .06), and the average for students without IEPs held between 242 and 245. NAEP’s own significance testing puts the decline for students with IEPs at 8 points (p < .0001) and the gap’s widening at 11 points (p < .0001), against a reference line that held still. This forecloses the obvious counterargument before it is raised: this was not a general decline dragging everyone down, and it was not a rising tide that missed one boat. The system-wide line did not move. One population’s line did.
The pattern is not a grade 4 mathematics artifact. Students with IEPs declined significantly from 2009 to 2019 in every subject at every grade NAEP tests: grade 4 reading (7 points, p < .0001), grade 8 mathematics (4 points, p = .0004), grade 8 reading (3 points, p = .0091), grade 12 reading (4 points, p = .0319), grade 12 mathematics (4 points, p = .0477 — significant, though barely, and this section does not lean on it alone). Six cells, six significant declines, all complete before COVID-19 existed. Meanwhile the all-students averages at grades 4 and 8 show no statistically significant change across the same decade in any cell. The decade was normal. The decline was specific.
The second act, read carefully
Then 2020, and the record’s second act reads differently — and more deceptively. Between 2019 and 2024 scores fell broadly, and the gaps narrowed in several cells: 5 points in grade 4 reading (p = .0004), 3 in grade 8 reading (p = .0032), 6 in grade 12 mathematics (p = .0005). Read quickly, that is progress. Read the row for students with IEPs and it is not. Grade 4 reading for these students was 180 in 2019, 180 in 2022, and 180 in 2024 — statistically flat (p = .51) — while the average for everyone else fell 5 points. The gaps narrowed because the comparison group came down, not because anyone came up. Across the full matrix, 2009 through 2024, there is no cell in which students with disabilities significantly improved. Four of six show significant 15-year declines. The remaining two — both at grade 12 — show no significant change at all.
Grade 12: the exit reading
Grade 12 deserves its own paragraph, because it is the exit reading and the law states its own criterion. IDEA’s declared purpose (20 U.S.C. § 1400(d)(1)(A)) includes preparing children with disabilities for further education, employment, and independent living. Grade 12 is where the system’s work product leaves the building. The finding there is flatness: twelfth-graders with IEPs in 2024 posted essentially the scores of twelfth-graders with IEPs in 2009 (mathematics p = .73, reading p = .09). Fifteen years, one full reauthorization era, no measurable movement at the door.
And grade 12 mathematics contains the single statistically significant gap improvement anywhere in this record: 5 points of narrowing over 15 years (p = .019). Its mechanism deserves exact statement, because someone will quote it as progress. The average for students with IEPs did not significantly move. The average for everyone else fell 6 points. The only significant improvement in the matrix is produced entirely by the comparison group’s decline. In an FIE, no evaluator would write that a student closed the gap with peers because the peers got worse; the sentence would not survive review. In outcome reporting, it survives press releases.
And one guardrail from the instrument’s own authors, honored here and worth honoring generally: NCES cautions that NAEP’s Proficient level does not correspond to grade-level proficiency as states define it (NCES, n.d.-b). The scores in this section are read as movement and distance, not sharpened into claims they were not built to hold.
The standard-administration file
Before graduation rates, the seams, because this instrument has them and each has a date. Accommodations were not permitted in NAEP before the late 1990s (NCES, n.d.-a); in the reading assessments of 1992 and 1994, roughly half of the fourth-graders identified with disabilities were excluded (NCES, 2025), and the national numbers looked better for their absence. NAEP began separating IEP students from 504-only students in 2009 — hence this section’s anchor. Grade 12 mathematics was rebuilt onto a new framework in 2005. And inclusion itself moved: after the National Assessment Governing Board’s 2010 policy set a 95% inclusion goal (National Assessment Governing Board, 2018), the share of identified fourth-graders with disabilities actually sitting for the reading test rose from about 60% in 1998, the first year accommodations were permitted in reading, to 89% in 2024, while identification itself grew from 10% of all fourth-graders to 17% (NCES, 2025).
Two consequences follow, and honesty requires both. First, rising inclusion pulls lower-performing students into the tested sample over time, which means some part of any long-run decline is composition. The effect is far smaller inside the 2009–2024 window than across the 1990s, but the caveat travels with the trend, and it travels here. Second — and this entry belongs in the strengths inventory when this evaluation writes one — the inclusion correction is the record behaving well. The system was made to report on itself more honestly, and it complied. The numbers got worse because the sample got more truthful. Credit where due; the harder findings are more believable for it.
Graduation: 50 instruments wearing one name
The four-year adjusted cohort graduation rate is the other national outcome measure, and it says what NAEP says in different units. In 2016–17, 67% of students with disabilities graduated in four years with a regular diploma, against 85% of all students (National Center for Education Statistics [NCES], 2018). In 2021–22 it was 71 against 87 (NCES, 2024a). Progress: the gap narrowed from roughly 18 points to 16. Now do the arithmetic on the rate, because rate is the diagnostic quantity. Two points of closure in 5 years — 0.3 to 0.4 points a year, depending on rounding. At that rate the gap closes sometime in the 2060s or 2070s. A student entering kindergarten this fall will be raising teenagers of her own before the line meets itself. And the most recent observed movement runs the wrong way: from 2020–21 to 2021–22 the overall rate rose a point while the rate for students with disabilities held at 71. The gap widened even as the headline recovered. The direction, on net, is right. The rate is the finding.
But the ACGR is not one instrument. It is 50. States define their own diploma requirements, which makes graduation the least standardized measure in this record, and the table’s own contents prove it. In 2021–22 the graduation rate for students with disabilities ran from 49% in New Jersey to 84% in Florida — a 35-point spread for the same population under the same federal law. In 2016–17, Mississippi graduated 36% of its students with disabilities on time while graduating 83% of its students overall; five years later Mississippi’s figure was 67, a 31-point rise. New Jersey ran the film in reverse: 79% in 2016–17, 49 by 2021–22, a 30-point fall. Students do not collapse or recover by 30 points in a cohort. Definitions, diploma pathways, and reporting practices do. Single-state, single-year graduation figures are readings of state policy, not of students, and nothing above should be read as ranking anyone’s services. The swings themselves are the evidence: the instrument is the variable.
The record documents its softer failure modes in its own footnotes. Alabama’s education department misstated its graduation data for 2010–11 through 2013–14, per a federal oversight report. In 2019–20, some states changed their diploma requirements to account for the pandemic, at each state’s discretion — the table’s note, not mine. And beginning in 2017–18, the ACGR definition itself expanded to count state-defined alternate diplomas for students with the most significant cognitive disabilities as graduation (NCES, 2024a). The number rises; no student received anything different.
The second ledger
A reconciliation note, so no reader has to catch it: the federal government keeps a second exit ledger. IDEA’s own data track every student age 14 to 21 who leaves special education — about 464,000 in 2021–22, of whom 74% graduated with a regular diploma (NCES, 2024c). That figure will not match the ACGR and cannot be made to; the two measures count different populations by different rules. Within the exit ledger, the spread does the talking: 84% of students with hearing impairments left with a regular diploma against 40% of students with multiple disabilities; 78% of Asian students against 68% of Black students; dropout ran from 6% for Asian students to 26% for American Indian and Alaska Native students. The averages, here as everywhere in this record, are the least informative numbers on the page.
Consistency of presentation
Last, the cross-instrument observation, offered as a data-interpretation caveat and nothing more. Twice in this record, a measured quantity improved because the criterion moved rather than the performance. Before 1998, national test results excluded roughly half of identified students with disabilities and looked better for it; when NAEP closed that door, the reported numbers dropped toward the truth. In 2017–18, the graduation definition expanded, and the graduation number rose without a single additional student receiving a regular diploma. When one instrument stopped permitting the behavior, it appeared in another. What that behavior is for is a later piece’s question; this one only documents it. But it imposes a reading rule with immediate force: no trend in this domain may be read as progress until you have checked whether the student improved or the criterion moved.
The domain, summarized
Summarized the way a present-levels paragraph would summarize it: across 15 years on the mandate’s own preferred instrument, students with IEPs show no statistically significant improvement in any subject at any grade tested; significant declines in four of six measures, all of them underway before the pandemic and against a system-wide line that was not moving; statistically unchanged performance at the exit grade, where the law states its own success criterion; a graduation gap closing at a pace that reaches parity around the time this year’s kindergartners are raising teenagers of their own; and a short list of apparent improvements that divide, on inspection, into exactly two kinds — comparison groups falling, and criteria moving. The mandate is 50 years old. On the 15 years it has let us see clearly, the population it governs was losing ground while everything around it held still, and the instruments that say otherwise turn out, one by one, to have been adjusted rather than answered.
Work-Sample Analysis
A cognitive report describes how a mind works. A work sample shows what it made. The evaluation now has both: the profile from the last domain, and the artifact this one examines — the IEP, which is the system’s writing sample. Every diagnostician knows the move. You do not take the district’s word for what a child can produce; you collect what the child actually wrote and you read it. So this section collects what the system actually writes.
One clarification before the sample is read, because a source appears here that appeared in the last domain, and it must not be spent twice. Piece 2 used Endrew F. (2017) for its legal holding — the Supreme Court’s rejection of the de minimis standard, the requirement that a child’s program be reasonably calculated to enable progress. That was doctrine. This section does not touch the holding. It reads Endrew’s record — the document itself, the actual goals in the actual file — as a work sample, the way an evaluator reads any artifact: for what it reveals about the process that produced it. The holding is law; the record is product. Same case, two entirely different evidentiary uses, and no sentence here relies on the first.
The record, read that way, shows a pattern any diagnostician would flag on sight. Endrew’s IEP goals were carried forward year over year — the same objectives, re-dated, with the numerals adjusted and the substance unchanged. In an evaluation, a portfolio of work in which every sample is last year’s sample with a new date is not a portfolio; it is a photocopy, and it tells you the producer stopped generating novel output some time ago. The system’s own writing sample shows a producer recycling its work.
And Endrew is not the anomaly; it is the visible instance of a documented practice. In a review of the IDEA’s proceduralist turn, Turnage found districts carrying goals and objectives forward from year to year and treating the existence of the IEP as its own proof that a child was receiving an appropriate education — procedure standing in for substance, the form counted as the thing the form was supposed to produce (Turnage, 2020). The recycled goal is not a local failure of one district’s diligence. It is what the instrument is built to permit.
The sharpest evidence, though, is not in any completed IEP. It is in the blank one — the goal bank the writing sample is assembled from, before a child’s name is entered.
Frontline Education’s (n.d.) eSPED platform — a commercial IEP system in wide use in Texas districts, and the platform this evaluator has worked in since at least 2011 — supplies the container. The contents are local: every entry in a district’s bank was written by people in that district, saved to the menu, and inherited by whoever arrived next. The architecture is not particular to this platform: a competing system’s own documentation describes the identical design independently — district-level banks of stored text, set to auto-populate new documents, which the vendor describes as “meant to act as a template for staff to follow” (SameGoal, n.d.). Two unrelated companies, selling into the same market, built the same menu. Read that menu as a work sample and the form-document finding stops being an inference about how goals get reused and becomes a fact about how they are manufactured. The bank audited here offers 13 consecutive vocabulary entries identical but for a single swapped noun: use vocabulary from literature… from social studies… from science… from mathematics… — one verb, 13 subjects, a mail-merge wearing the costume of individualized planning. Its addition strand offers 21 variations on a single instruction to add.
And the vendor knows exactly what a good goal is, because it wrote that down too.
Frontline publishes a best-practice guide on annual goals — a public document anyone can download. The guide instructs writers to avoid what it calls the common pitfall of copying and pasting. It says goals must not restate the general education curriculum. It says every goal must be student-specific — and it gives, as its example of an inappropriate goal, one that fails to address the student’s individual needs. It says: state goals clearly and simply, and if you do not understand the goal, how can you expect a parent to? Most precisely of all, it tells the writer to select goals that answer one question — what skills does the student require to master the content of the curriculum? — rather than the question of what content the student should master.
It is, very nearly, the standard this evaluation would have written.
So the obvious finding presents itself, and it is the one this section expected to make: the company knows better and sells worse. The guide says one thing, the drop-down does another, and individualization is what the vendor markets.
That finding is wrong, and the guide itself is what refutes it.
Because the guide does not stop at the standard. It works an example. It selects a model annual goal — a student reading orally at 80 to 100 words per minute — and it breaks that goal into the short-term objectives it holds up as correct. There are three. The student will identify and record unfamiliar words. The student will make a prediction about the passage. The student will self-monitor his fluency and accuracy.
Identify. Predict. Monitor.
Set those three verbs beside the enrolled-grade standard the error-pattern analysis will code, and they land exactly where the drop-down lands: at the bottom of the taxonomy, in the register of remembering and understanding, nowhere near the analysis the grade-level standard asks of the children sitting beside this one.
The vendor’s exemplar fails the vendor’s standard, in the vendor’s own document, two pages after stating it.
This is not hypocrisy. Hypocrisy would be easier, and would have an obvious remedy: hold the company to its word. There is no gap here to hold anyone to. The guide is not a good standard betrayed by a bad product — the guide is where the field’s own picture of a goal is written down and called best practice. Frontline did not fail to describe good goal-writing. It described what the field already believes good goal-writing is, unhurried, in a document it had every reason to get right.
Which means the drop-down is not a shortcut around the standard. The drop-down is the standard, rendered in software. The 13 ways to identify vocabulary were not written by the company at all. They were written inside a district, by colleagues, under a caseload — and they arrive at the same register as the exemplar a vendor composed at leisure for publication. Two sets of authors who never met, working under conditions with nothing in common, drawing the same picture of what an IEP goal asks a child to do.
And the supply is deep. There are other banks — free ones and paid ones, vendor menus and district uploads and blog posts written by credentialed specialists giving their work away — and a writer who wanted one has never had to look far.
And now the finding is properly stated. The individualized education program — the artifact whose first adjective is individualized — is, in the record and in the tooling that produces it, substantially a form: recycled where it is not pre-written, pre-written where it is not recycled, and in both cases documenting a process that generated a compliant document without generating the individualized thinking the document was invented to require. The same architecture governs the accommodation menu, and the accommodation is the easier document to assemble, because a goal at least demands a baseline and an accommodation demands only a category.
The vendor is not the villain of this story. The vendor is a witness, and a candid one. It wrote down what the field believes a goal should ask a child to do, and then it built the field a place to keep exactly that, where it would be waiting for the next writer.
Which is where this evaluation owes a disclosure, because there is one more witness in the room.
I have selected from that menu. Not in ignorance — I have known exactly what the drop-down was doing, and I have clicked it anyway, at 11 o’clock at night, with a 45-school-day timeline and a caseload that did not care what I knew. Every diagnostician reading this has done the same thing, and not one of us needed a coded corpus to tell us what was in the bank. We could see it. We have been able to see it the entire time.
Not a confession — the last piece of evidence.
Because if the practitioners knew — and they did — then the failure was never a knowledge failure, and no amount of better information was ever going to fix it. The field has been reporting this accurately for decades. It reported it at ARD tables, in hallways, in the exhausted shorthand practitioners use with each other about which goals are real and which ones are there because the form has a box. The report was filed, over and over, by the people closest to the child.
Nobody ever came out to evaluate it.
Not a discovery — there is nothing here that a diagnostician did not already know, and saying otherwise would insult the people best positioned to check the work. What is new is not the claim. It is the file. Nobody had coded the bank against the enrolled-grade standard with a map fixed in advance and a tiebreak aimed against the thesis. The knowledge was never missing. The documentation was, which is the one thing this profession exists to supply — and which the profession, in its own case, had never once been given.
So I am not the exception to the finding and I am not its subject. I am its informant, and so is every practitioner who has clicked that menu knowing better. We were the reporters of record. We were right. The error-pattern analysis does the thing that should have been done for us a long time ago: it takes the report seriously enough to test it.
The error-pattern analysis takes the same samples and does the error analysis — not whether the goals are reused, but what, specifically, they ask a child to do, and how far beneath the enrolled-grade standard the ask has been set. It will find that the menu tops out at apply while the standard the child is enrolled in reaches analyze a third of the time.
It will find, in other words, that the guide was telling the truth about the field all along.
Error-Pattern Analysis
Every diagnostician has done error analysis on a work sample. You do not score it. You lay the errors out and look for the pattern, because the pattern is the finding. A child who misses every multi-step problem and none of the single-step ones is not bad at math. The score cannot tell you that. The errors can.
The goal bank is a work sample. It has never been read as one.
To read it, you need one tool, and it is one the system already uses. Bloom’s taxonomy (Anderson & Krathwohl, 2001) ranks what a task asks a child’s brain to do, from the bottom up: remember it, understand it, apply it, analyze it, evaluate it, create with it. Name the parts of a plant sits at the bottom. Explain why this plant died sits near the top. Same subject, different demand.
Bloom’s is used here for one reason: the system uses it. It is printed in curriculum guides, in teacher preparation, in the goal-writing trainings the system runs itself. The question is not whether the ranking is correct. The question is where the system’s own goals land on the ranking the system says it believes in. Nobody picked this yardstick to make the examinee look bad. The examinee picked it.
Eighty goals from one district’s bank, held in that platform, were coded against 81 grade-level standards from the Texas Essential Knowledge and Skills (TEKS), using the same ranking (19 Tex. Admin. Code §§ 110.24, 111.5, 2026), by the same reader. Here is where the verbs land.
The verbs
| Remember / Understand | Apply | Analyze / Evaluate / Create | |
|---|---|---|---|
| District goal bank (80 goals) | 64% | 35% | 1% |
| Grade-level standard (81 TEKS) | 12% | 54% | 33% |
Note. Author’s coding of 80 goals from one district’s goal bank and 81 TEKS student expectations from Grade 3 mathematics and Grade 8 English language arts and reading (19 Tex. Admin. Code §§ 110.24, 111.5, 2026), sorted with the revised taxonomy (Anderson & Krathwohl, 2001) on a map fixed before coding; ambiguous verbs scored at the lower level.
Read the right-hand column twice. The grade-level standard asks a child to analyze, evaluate, or create in a third of what it asks of her. The bank her goal is written from does it once. One behavior out of 80.
Put plainly: her classmates are being asked to think at the top of the scale a third of the time. Her IEP goal, drawn from the menu, almost never asks her to go there at all. At the threshold that matters, the goal bank reaches apply or above in 36% of its behaviors. The standard reaches it in 88%.
What the percentage is not
There is an obvious challenge to a number like that — you picked easy standards. The answer to it turns out to be the real finding.
The standard moves with the content. Grade 3 data analysis is modest and codes low. Algebraic reasoning and geometry climb. What the standard asks of a child rises and falls with what the subject actually requires her to think about, because the standard was written by people describing content.
The goal bank does not move. Reading, writing, mathematics — it flatlines at Apply no matter the subject. It does not respond to content, because it was never about content.
That is the fingerprint. A goal bank that tracked what children were being asked to learn would vary as that changed. This one does not vary. It was built to fill a field, by people who had a field to fill.
How this was checked, for anyone who wants to check it back. The goal list came from a single district’s bank inside that platform. The standards came from the same platform’s own TEKS tab, verified word for word against the Administrative Code. Every verb was sorted using a map written down before the sorting started, so the results could not drift toward the answer. Where a verb could be read two ways, it was scored the lower way, the reading most generous to the goal bank and least favorable to this evaluation’s own argument. That is the same rule the battery section held at the .05 line: a rule that helps the finding is held to the same standard as one that hurts it, or it is not a rule.
Two things this section did to try to break its own finding. First, a second bank was coded on the identical map — a district library from Redmond, Oregon, built for a different commercial platform in a different state, and posted publicly online (IEP Goals and Objectives Bank, n.d.). It still circulates: a New Jersey family advocacy organization currently points parents to it as a resource for organizing IEP goals by content area (IncludeNJ, n.d.). Different authors, different district, different software. The verbs landed in the same place. Whoever writes them, and wherever they write them, they come out at the same height. Second, the grade 3 mathematics standards were added after the first result was already in hand, and they pulled the standard’s high-demand share down from 44% to 33%. The finding survived its own correction. The number in the table is the number after the evaluation went looking for reasons to doubt itself.
The limit, named up front
One reader coded all of this. That is weaker than two readers and stronger than an assertion, and you are entitled to know which one you are reading. The map was written down before coding began and is available on request. The standards side can be re-run by anyone against the Administrative Code, and so can the Redmond bank; the primary goal bank cannot, because it is a licensed district instance transcribed under that license, and it enters this record as an evaluator’s observation rather than a public data set. And the claim is bounded: the academic goals examined top out at apply. Not that no analytic goal exists in any bank anywhere. And the corpus is one district’s bank, which is the only kind this platform has — there is no national list to sample from, because the contents are written locally and turn over as staff turn over. A second district would yield a different 80 goals. Whether they would land differently is the question the Redmond bank above was coded to answer.
What the verbs mean
The vendor’s own guide already told us, though not in the way it meant to. Its model goal — the one it holds up as correct — breaks into three objectives: identify unfamiliar words, make a prediction, self-monitor. Remember. Understand. Understand. The exemplar and the drop-down are the same picture, drawn twice. The exemplar a company published and the drop-down a district wrote converge on the same three registers by wholly separate routes. Neither one is a claim about the other. Both are the field, drawing itself.
A goal bank that asks a child to identify while her enrolled grade asks her to analyze has not lowered the bar for one student after individual consideration. It lowered the bar before the student arrived — for every student, as the default, as the state the menu was already in when the writer opened it — and then offered 13 ways to phrase it.
The misread hierarchy was seeded at Piece 2. Here is the hand that misread it.
For a tool built to name that hand — which lens actually wrote a given goal — see the Five Questions lens tool on the hub: https://barbersped.org/five_questions_lens
Functional Performance
The statute names three destinations: further education, employment, independent living. The standardized battery previewed them at the exit door. This section asks what happened after the child walked through it.
Two of the three have a federal instrument. The third has none — and every proxy available for it excludes, by design, the people who most conclusively failed to reach it.
That is the finding.
Further education
Roughly 24% of adults age 25 and over with a disability hold a bachelor’s degree, against about 42% of those without (U.S. Bureau of Labor Statistics, 2026a). Twenty-one percent of undergraduates report a disability (NCES, 2023), but only 8% of students are registered with their institution as having one (Postsecondary National Policy Institute, 2026), which is its own quiet finding about the distance between having documentation and receiving anything.
Employment
22.8% employed, against 65.2% (U.S. Bureau of Labor Statistics, 2026b). A 42.4-point gap. One seam, stated and set aside: the 2025 annual figures are 11-month averages, because October was not collected during the federal shutdown, so BLS cautions they are not strictly comparable with other years (U.S. Bureau of Labor Statistics, 2026a).
The reflex is to explain it away by age: people with disabilities skew older, and older people work less. So take age off the table. Working age, 16 to 64: 38.1% against 74.8%. The gap is 36.7 points and it does not go away.
Then take education off the table, and the floor gives out. An adult with a disability who holds a bachelor’s degree or better is employed at 31.3%. An adult with no disability who never finished high school is employed at 55.0%. The credential the system spent 13 years pointing at, achieved, is worth 24 points less than the plain absence of a disability. Whatever is happening at the exit door, it is not a skills problem.
And the instrument’s title is itself the first exclusion. Employment status of the civilian noninstitutional population. Institutional residents are not undercounted. They are outside the frame by definition, in the header of the table.
Independent living: the destination with no instrument
Five proxies. Five exclusions.
The ACS collects it, then drops it. Census has sampled institutional group quarters since 2006 (Brault, 2008), and its own guidance then states that poverty estimates derived from the ACS exclude people living in them. The data is gathered and discarded. Every figure of the roughly a quarter of adults with disabilities live in poverty variety (Institute on Disability, 2025) carries a qualifier printed in the table’s own text: living in the community. And Census knows what the omission costs — its own analysis found that 49.4% of people in institutional group quarters report a disability (Brault, 2008).
SSI redetermines them out. At age 18, every child receiving Supplemental Security Income has eligibility re-decided under the adult standard, treated as a new application. Nothing about the young person’s condition has to have improved; the rules are simply stricter, and the file is read fresh.
Across the eight years SSA (Hemmeter & Gilby, 2009) studied in its own administrative records, 402,601 youth went through that redetermination. 170,376 — 42.3% — received an initial determination of not disabled.
Two disciplines apply to that number, and this section applies both against itself. First, initial is not final: about half of adverse determinations are appealed, roughly a fifth of adverse initial decisions are overturned, and SSA’s own accounting puts final cessation at about a third of all redeterminations. This section therefore does not say that 42% lose benefits. It says that 42% are told they are not disabled, and that about a third of everyone redetermined ultimately loses eligibility. Second, that is the more damning figure, not the softer one, and it should be stated as such: a third of the young people the education system spent 13 years serving are told by a second federal system, in the same year they exit, that they were never disabled enough to qualify.
But the finding is not the headline rate. It is the distribution.
Sort SSA’s own cessation rates by diagnosis and the instrument declares itself:
| Primary diagnosis at redetermination | Initially found not disabled |
|---|---|
| Schizophrenia, psychoses, other neuroses | 15.1% |
| Intellectual disability | 19.2% |
| Sensory disabilities | 20.4% |
| Physical disabilities | 34.3% |
| Major affective disorders | 54.6% |
| “Other mental disorders” | 68.4% |
| “Other/uncodable disabilities” | 91.0% |
Note. Share of youth initially found not disabled at the age-18 redetermination, by primary diagnosis. Data from Hemmeter and Gilby (2009).
Read the bottom row twice. The category for children whose disability does not correspond to an adult listing is denied at 91%.
That is not a finding about those children. That is a finding about the instrument. The adult listings were not built with them in mind, so the instrument has no row for them — and having no row is scored, operationally, as having no disability. The same is true one line up: other mental disorders, the bin that carries much of autism and the developmental diagnoses, is denied at more than two-thirds, while intellectual disability — the category with a clean adult listing and the one defined by permanence — is denied at 19%.
The difference between 19% and 91% tracks legibility to the form, not disability.
And now hold that against the education system’s exit. In the same year a young person leaves a program whose declared third purpose is independent living, a second federal system reviews the same young person under different rules and tells more than two in five of them they do not qualify — with the denial rate driven not by severity but by whether their disability fits a category the adult form happens to contain.
Two federal determinations. One young adult. One year. Opposite conclusions. Neither system reads the other’s file.
Indicator 14 grades its own homework. Texas shows the work.
This is the reflexive exhibit — the federal post-school outcomes requirement, the instrument built to answer exactly the question this section is asking. And because Texas publishes its methodology in full, the whole mechanism can be watched operating in daylight (Gibson Consulting Group, 2024).
First, it measures the wrong things. The three measures are higher education, competitive employment, and other education or employment, each within a year of leaving. Independent living is not in the indicator. The federal post-school outcomes requirement omits one of the three post-school outcomes the statute names. The destination with no instrument does not have one here either.
Second — and this is the finding — the denominator is respondents, not leavers. Texas prints the formula in its own report: SPPI 14A is the percentage of respondents who are enrolled in higher education. Not the percentage of exited students. The percentage of the ones who answered.
So do the arithmetic the state does not do.
Texas surveyed the students who left with an IEP in 2022–23: 39,533 of them. It is a census, not a sample; the state tried to reach every one. It sent emails, texts, postcards, and made phone calls — more than 1,144,000 contact attempts, an average of 28.9 per student.
10,591 responded. A response rate of 26.8%.
Texas then reports that 28% were enrolled in higher education and 56% were in higher education or competitively employed. Both numbers are percentages of the 10,591.
Recompute them against the 39,533 young people who actually left:
| Measure | As published (÷ respondents) | Against all leavers (÷ 39,533) |
|---|---|---|
| 14A — higher education | 28% | 7.5% |
| 14B — higher ed or competitively employed | 56% | 15.0% |
| Not heard from at all | — | 28,942 young people |
Note. Published rates from Gibson Consulting Group (2024). Recomputed against all 39,533 leavers by the author.
Twenty-eight thousand, nine hundred and forty-two. Not recorded as failures. Not recorded as anything. They are not in the numerator and they are not in the denominator. They left the building and the instrument closed behind them.
And the composition of the quarter who did answer is its own finding, printed in the state’s own tables.
Start with who is speaking. 78% of “respondents” are a parent or family member, not the young person. On an instrument built to measure whether a young adult achieved independence, three out of four voices belong to someone else.
Then look at who was reached. Texas publishes the disability composition of the leaver population and of the respondent population side by side. Set them against each other and the nonresponse resolves into a pattern:
| Primary disability | Share of leavers | Share of respondents | Implied response rate |
|---|---|---|---|
| Autism | 12.5% | 17.2% | ~37% |
| Visual impairment | 0.6% | 0.8% | ~36% |
| Orthopedic impairment | 0.6% | 0.7% | ~31% |
| Other health impairment | 16.6% | 17.7% | ~29% |
| Intellectual disability | 12.8% | 12.6% | ~26% |
| Emotional disability | 9.9% | 9.1% | ~25% |
| Learning disability | 44.5% | 39.4% | ~24% |
| Traumatic brain injury | 0.3% | 0.2% | ~18% |
Note. Shares of leavers and respondents from Gibson Consulting Group (2024). Implied response rate = share of respondents ÷ share of leavers × the 26.8% overall response rate, computed by the author.
The instrument does not fail at random. It fails by category.
A student with autism is roughly half again as likely to be counted as a student with a learning disability — and learning disability is not a marginal group. It is 44% of everyone who left. The single largest population in special education is the one this instrument is worst at finding, and the state’s own report says the correction exists and was not applied: statistical re-weighting can adjust for non-representativeness, but is not applied here.
Which means the published Texas outcome is not merely computed on a quarter of the cohort. It is computed on a quarter selected for, among other things, having a parent still engaged enough to answer a survey on their adult child’s behalf — and selected against the largest disability category the system serves.
And the state names the underlying problem itself, in plain words: the target population for the survey remains difficult to reach.
Then, having established every one of those facts about its own data, the report concludes: the current response rate is more than adequate for statewide estimates.
Read that against what the state just documented. Texas set out to find 39,533 young people it had spent 13 years educating. It made more than a million attempts. It found a quarter of them, mostly by reaching their mothers. And it called that adequate — because for the purpose the instrument actually serves, it is.
Third, the definitions move. States select their own data source, sampling is permitted where Texas uses a census, and OSEP offers more than one way to define competitive employment. This is the ACGR problem again — 50 instruments wearing one name — arriving as a second exhibit for the same finding, which is the point at which a reader should stop calling it coincidence.
And the sharpest fact is that none of this is hidden. OSEP requires states to analyze response rates and report nonresponse bias (Gibson Consulting Group, 2024). The system knows the hole is there. It requires you to measure the hole, describe the hole, and submit a report about the hole — and then it lets you compute the outcome as if the hole were not there. The federal requirement is to document the exclusion, not to correct it.
That is the whole problem in a single formula. The paperwork about the missing children is complete.
The one instrument that asks directly can only see the people still being held. National Core Indicators (NCI; Human Services Research Institute & National Association of State Directors of Developmental Disabilities Services, 2024) measures residential setting outright. Across 13,559 adults with IDD in 27 states: family or relative’s home 40%, community-based residential 36%, own home 15%, host home 5%, institutional 4%.
Fifteen percent. That is the independent-living outcome, measured directly, by the only instrument that bothers to measure it.
NCI also asks about work, and the answer forecloses the oldest excuse in the file: 17% hold a paid community job — and among those who do not, 44% say they want one. Whatever explains the employment number, it is not that they do not want to work. The system’s own instrument asked them, and they said so.
But note the frame. NCI surveys adults already receiving case management and at least one paid service from a state system. The only instrument that asks the independent-living question can only ask it of the people the system still has hold of. Everyone who fell out of state services — the ones for whom independent living most conclusively failed — is not a low score. They are not a respondent.
The federalism defense, and why it dies
A federal system must be normed against other federal systems — an OECD (2022) average across unitary and federal states is the wrong comparison, for the same reason the battery section gave: averages are the least informative numbers on the page.
So take the federal subgroup. Across 32 OECD countries in 2019, about 42% of people with disabilities were employed, and the gap averaged 27 points — a figure OECD notes has held constant for a decade. Canada employs 54%. Switzerland employs 58%, the highest in the set, with gaps under 20 points. Both are federal. Switzerland is in fact more devolved than the United States: its cantons run their own disability insurance offices, with documented variation between them in access and quality.
That is the American structural excuse, stated precisely — and Switzerland runs it and produces a sub-20-point gap.
But the sentence that ends the argument is one OECD wrote, not one this evaluation constructed. Reporting the range of the gap across all 32 countries, the report says it runs from around 15 points in Mexico, Chile, and Switzerland to over 35 points in Lithuania and the United States.
The United States is named, by the OECD, in its own worst-performers clause.
And on poverty, OECD does not bother with a range: the United States continues to be the country with the largest disability poverty gap. Not among the largest. The largest — of 32.
Federalism is not the explanation. Other federal systems have the identical coordination problem and do not produce this outcome.
And the closing exhibit writes itself. When the United Kingdom’s Department for Work and Pensions assembled a comparison group for its international disability review, it considered the United States and left it out — deemed less comparable than other countries owing to its distinctive labour market context, and therefore de-prioritised (Department for Work and Pensions, 2026).
Another government, building a norm group, looked at the United States and concluded it was not comparable to anyone.
The guardrail, attached rather than buried: OECD’s own authors note that disability self-report shifts across countries and over time enough to make policy impact on the gap difficult if not impossible to measure — a successful policy can change who reports a disability in ways that make the gap look worse. That is criterion movement in international dress, stated by the instrument’s own custodians. International figures therefore enter this section as context with declared measurement error, never as a ranking.
The close
Three instruments, examined closely. Three times, the same structure.
SSA denies at 19% where the disability fits an adult listing and at 91% where it does not — a rate driven not by how disabled the young person is but by whether the form has a row for them. Texas reaches 37% of leavers with autism and 24% of leavers with a learning disability — and learning disability is the largest category in special education. NCI can see residential outcomes at all, but only for adults still inside a state service system, which excludes by construction everyone for whom independent living most conclusively failed.
Read those three together and the common term is not error. It is selection. Every one of these instruments loses people, and not one of them loses people at random. Each loses them along the exact axis the instrument was supposed to be measuring — legibility to a form, reachability by a survey, retention in a service system — so that in each case the young person who most conclusively failed to reach the destination is the young person the instrument is least able to see.
That is not a data-quality problem to be corrected in a future administration. An instrument that systematically cannot see failure will report success at any level of actual performance, and it will do so honestly, in good faith, with its methodology published and its response rates disclosed. The paperwork about the missing children is complete.
The standardized battery established the reading rule: no trend counts as progress until you have checked whether the student improved or the criterion moved.
Functional performance adds the corollary, and it is the harder one. Before you read any score, check whether the instrument can see the thing it claims to measure. Not whether it is precise. Whether it is pointed at the outcome.
And on the destination the statute named third, the answer is that the criterion was never built at all.
Employment has BLS. Further education has NCES. Independent living has no dedicated federal series — it must be reconstructed from tables built for other purposes, and every one of those tables has already removed the people who most conclusively failed to reach it. The institutionalized are outside BLS’s universe by the title of the table. They are counted by the ACS and then dropped from its poverty estimates. They are redetermined off SSI at 18, and about one in three is ultimately ceased. And in Texas they are among the 28,942 young people who did not answer the survey and therefore did not happen.
The one instrument that asks directly can see only the people still inside a state service system.
Fifty years, and the outcome the statute named third is the one the federal government never built an instrument to measure.
You cannot fail a test that was never administered. That is not the same as passing it.
Interpretation
Before interpreting anything, restate what was measured, because the file is the only thing that licenses what follows.
Six NAEP cells, each carrying its own significance test. One coded goal-bank corpus against one coded standards corpus — same tool, same coder, same map, tiebreak against the thesis. Three statutory destinations, examined through the instruments that claim to measure them. That is the file. Everything below is inference from it, and nothing below is asked to carry more than it can.
Start with the prediction, because this domain did not open with a hypothesis of its own. The cognitive domain closed on a profile: strong crystallized knowledge, weak fluid reasoning, slow processing, impaired working memory. And it closed by naming, precisely, what such a learner produces — output that looks fine on paper while comprehension has quietly stalled. Then it asked whether the product would match.
It matched.
The achievement record shows a system that has absorbed every reform and improved on none of them. The work sample shows a document that is correctly formatted and substantively empty. The verb audit shows goal-writing that performs the skill it was taught — measurable, standard-coded, criterion-referenced — while the ceiling it sets on the child never moves. And the outcomes record shows a system that satisfies every measurement requirement placed on it while producing instruments that cannot see the children who failed.
Not a new finding. The predicted one. Acquisition without transfer, named in the cognitive domain, now documented in the product: the skill performs on demand and changes nothing downstream. Every reform of the last 30 years was learned. None of them transferred.
The discrepancy is a confirmation, not a discovery — and confirmation is what an evaluation is for. When ability is intact and achievement is not, you do not conclude the student cannot. You conclude something is intervening between knowing and doing, and you go and find it.
What reconciles them is the compliance trap. The term is this evaluation’s; the pattern is documented. Skrtic (1991) traced it to the bureaucratic organization of schools and the professional culture of special education, and hospital researchers have watched professionals play it out as “tick-box games” (McGivern & Ferlie, 2007, p. 1380): the requirement is met, and the practice does not change. The product is simultaneously compliant and poor — documented and undelivered: the trap, working exactly as designed.
And the file does not have to argue the fit, because the functional-performance section caught the trap in the act of operating.
Texas set out to find the 39,533 young people it had spent 13 years educating. It made more than 1,144,000 contact attempts — 29 per student. It reached a quarter of them, mostly by getting a parent on the phone. It documented, in its own published report, that the students it failed to reach were disproportionately the largest disability category it serves. It noted that a statistical correction for that bias exists. It did not apply it. And it concluded — accurately, by the standard that governs it — that the response rate was more than adequate.
Every step of that is compliant. The survey was administered. The nonresponse was analyzed. The representativeness was tabulated and published. The federal requirement was met in full, on time, with the methodology disclosed.
And at the end of it, 28,942 young people are not in the file at all — and the state’s outcome number is not wrong. Not a cover-up. Not incompetence. A system doing precisely what is asked of it, producing a number that is technically true and substantively empty, and moving on.
The vendor closes the frame from the other end. Frontline published the standard and sells the tool that makes meeting it optional — and then, in the same guide, printed a model goal that fails its own standard. The compliance trap is not an abstraction about bureaucracies and institutional isomorphism (DiMaggio & Powell, 1983). It is a drop-down menu with a best-practice guide attached, and the guide is wrong in the identical way the menu is.
Set those two side by side and the interpretation writes itself. At the point of authorship, the system produces a document without producing the thinking the document was invented to require. At the point of measurement, it produces a number without producing the knowledge the number was invented to supply. Same failure, opposite ends of the child’s file — and in both cases the paperwork is complete, the requirement is satisfied, and nobody has broken a single rule.
The limits. Skrtic described its organizational roots in 1991. Tomlinson named the political economy in 1982. The work-sample analysis has already said what this evaluation is and is not, and it does not need saying twice.
Domain Summary and Tee-Up
Cognition (Piece 2): intact. The system holds the frameworks. It cites the statute. It publishes the standard, and so does its vendor.
Academic and functional performance (Piece 3): poor.
No significant improvement in any NAEP cell in 15 years — and in grade 4 mathematics, no year since 2009 in which students with IEPs were not significantly below where they started. The decline is significant at every interval NAEP tests: 3 points by 2011, 4 by 2015, 8 by 2019, 10 by 2024 (NAEP’s own differences, computed before rounding). It did not pause, and it did not begin with the pandemic. Against it, the comparison line did not significantly move.
A work sample that is substantially a form — recycled where it is not pre-written, pre-written where it is not recycled.
Goals coded at 64% Remember-or-Understand against standards at 33% Analyze-or-above; Apply-or-above in 36% of the bank against 88% of the standard. Set before the child arrives.
Three statutory destinations, and three instruments that lose people — none of them at random. SSA denies at 19% where a disability fits an adult listing and at 91% where it does not. Texas hears from 37% of its leavers with autism and 24% of its leavers with a learning disability, the largest category it serves. The one instrument that measures independent living directly can only see adults still held inside a state service system. In every case, the young person who most conclusively failed to reach the destination is the young person the instrument is least able to see.
And the destination the statute named third — independent living — was never given an instrument at all.
That is the profile. Intact knowledge. Poor product. Fifty years, and an evaluation that had to be built from tables designed for other purposes, because nobody ever built one for this.
Which leaves the only question the file cannot answer:
The file cannot answer it. A file never can — that is what the rest of the evaluation is for.
Piece 4 — The FIE - Ecological Domain. What the environment permits the system to do.
Piece 5 — The FIE - Behavioral Domain. What the system’s maladaptive behaviors accomplish, and what keeps them in place.
Piece 6 — The FIE - Conclusions and Recommendations. What the evaluation found, and what an appropriately ambitious program would require — published on a schedule that answers to the argument, not the news cycle.
Related Hub Tools

References
- Anderson, L. W., & Krathwohl, D. R. (Eds.). (2001). A taxonomy for learning, teaching, and assessing: A revision of Bloom’s taxonomy of educational objectives. Longman.
- Brault, M. W. (2008). Disability status and the characteristics of people in group quarters: A brief analysis of disability prevalence among the civilian noninstitutionalized and total populations in the American Community Survey [Working paper]. U.S. Census Bureau. https://www.census.gov/library/working-papers/2008/demo/brault-01.html
- Department for Work and Pensions. (2026, February 26). International comparisons of disability benefits and disability employment [Research report]. https://www.gov.uk/government/publications/international-comparisons-of-disability-benefits-and-disability-employment
- DiMaggio, P. J., & Powell, W. W. (1983). The iron cage revisited: Institutional isomorphism and collective rationality in organizational fields. American Sociological Review, 48(2), 147–160. https://doi.org/10.2307/2095101
- Endrew F. v. Douglas County School District RE-1, 580 U.S. 386 (2017).
- Frontline Education. (n.d.). Core concepts for IEP goals: Best practices and frequently asked questions about annual goals and objectives for Individualized Education Programs. https://www.frontlineeducation.com/wp-content/uploads/2018/01/IEP_Goals_and_Objectives.pdf
- Gibson Consulting Group. (2024). Texas post-school outcomes survey: State Performance Plan Indicator 14 final report. Texas Education Agency. https://tea.texas.gov/academics/special-student-populations/special-education/post-school-outcomes-survey-report-ffy2023.pdf
- Hemmeter, J., & Gilby, E. (2009). The age-18 redetermination and postredetermination participation in SSI. Social Security Bulletin, 69(4), 1–25. https://www.ssa.gov/policy/docs/ssb/v69n4/v69n4p1.html
- Human Services Research Institute & National Association of State Directors of Developmental Disabilities Services. (2024). National Core Indicators—Intellectual and Developmental Disabilities: In-Person Survey national report 2021–22. https://www.hsri.org/national-core-indicators-idd-in-person-survey-national-report-2021-2022/
- IEP goals and objectives bank (Redmond, Oregon). (n.d.). [Goal bank designed for use in eSIS SPED Full software; file name RedmondGoalBank073003]. https://bridges4kids.org/IEP/iep.goal.bank.pdf
- IncludeNJ. (n.d.). IEP goal bank. https://includenj.org/resources/iep-goal-bank
- Individuals with Disabilities Education Act, 20 U.S.C. § 1400(d) (2004).
- Institute on Disability. (2025). 2025 annual disability statistics compendium. University of New Hampshire, Center for Research on Disability. https://www.researchondisability.org/annual-disability-statistics-collection/2025-compendium-table-contents/section-6-poverty-compendium-2025
- McGivern, G., & Ferlie, E. (2007). Playing tick-box games: Interrelating defences in professional appraisal. Human Relations, 60(9), 1361–1385. https://doi.org/10.1177/0018726707082851
- National Assessment Governing Board. (2018). Evolution of inclusion in NAEP. https://www.nagb.gov/news-and-events/news-releases/2018/naep-focused-reporting-inclusion-implementation.html
- National Center for Education Statistics. (n.d.-a). History of inclusion policy. The Nation’s Report Card. U.S. Department of Education, Institute of Education Sciences. https://nces.ed.gov/nationsreportcard/about/history_inclusion.aspx
- National Center for Education Statistics. (n.d.-b). How results are reported: Scale scores and NAEP achievement levels. The Nation’s Report Card. U.S. Department of Education, Institute of Education Sciences. https://nces.ed.gov/nationsreportcard/guides/
- National Center for Education Statistics. (2018). Table 219.46. Public high school 4-year adjusted cohort graduation rate (ACGR), by selected student characteristics and state: 2010–11 through 2016–17. In Digest of Education Statistics 2018. U.S. Department of Education, Institute of Education Sciences. https://nces.ed.gov/programs/digest/d18/tables/dt18_219.46.asp
- National Center for Education Statistics. (2023). Students with disabilities [Fast facts]. U.S. Department of Education, Institute of Education Sciences. https://nces.ed.gov/fastfacts/display.asp?id=60
- National Center for Education Statistics. (2024a). Table 219.46. Public high school 4-year adjusted cohort graduation rate (ACGR), by selected student characteristics and state or jurisdiction: School years 2011–12 through 2021–22. In Digest of Education Statistics 2023. U.S. Department of Education, Institute of Education Sciences. https://nces.ed.gov/programs/digest/d23/tables/dt23_219.46.asp
- National Center for Education Statistics. (2024b). NAEP Data Explorer [Data set]. National Assessment of Educational Progress. U.S. Department of Education, Institute of Education Sciences. https://www.nationsreportcard.gov/ndecore/landing
- National Center for Education Statistics. (2024c). Students with disabilities. Condition of Education. U.S. Department of Education, Institute of Education Sciences. https://nces.ed.gov/programs/coe/indicator/cgg/students-with-disabilities
- National Center for Education Statistics. (2025). Appendix tables for 2024 reading report card. National Assessment of Educational Progress. U.S. Department of Education, Institute of Education Sciences. https://www.nationsreportcard.gov/reports/reading/2024/g4_8/supporting-files/2024_technical_appendix_reading_state_district.pdf
- 19 Tex. Admin. Code § 110.24 (2026).
- 19 Tex. Admin. Code § 111.5 (2026).
- Organisation for Economic Co-operation and Development. (2022). Disability, work and inclusion: Mainstreaming in all policies and practices. OECD Publishing. https://doi.org/10.1787/1eaa5e9c-en
- Postsecondary National Policy Institute. (2026, January). Students with disabilities in higher education [Fact sheet]. https://pnpi.org/wp-content/uploads/2026/02/PNPI_StudentswithDisabilities_FactSheet_Jan26.pdf
- SameGoal. (n.d.). Training outline: General training guide [Training documentation]. https://samegoal.com/iep/g/support/online-guides/user-guide/general-training-guide/training-outline
- Skrtic, T. M. (1991). Behind special education: A critical analysis of professional culture and school organization. Love Publishing.
- Tomlinson, S. (1982). A sociology of special education. Routledge & Kegan Paul.
- Turnage, L. (2020). Out of sight, out of mind: Rural special education and the limitations of the IDEA. Columbia Journal of Law and Social Problems, 54(1), 1–46. https://jlsp.law.columbia.edu/wp-content/blogs.dir/213/files/2020/11/Vol54-Turnage.pdf
- U.S. Bureau of Labor Statistics. (2026a, March 3). People with a disability: Labor force characteristics — 2025 [News release]. U.S. Department of Labor. https://www.bls.gov/news.release/disabl.nr0.htm
- U.S. Bureau of Labor Statistics. (2026b). People with a disability: Labor force characteristics — 2025 (USDL news release; Table 1, 2025 annual averages). U.S. Department of Labor. https://www.bls.gov/news.release/disabl.t01.htm
- U.S. Census Bureau. (n.d.). Poverty universe data. Small Area Income and Poverty Estimates. https://www.census.gov/programs-surveys/saipe/guidance/model-input-data/denominators/poverty.html